01-Introduction
As I prepare to predict the upcoming election, I would like to start my blog series by analyzing past elections. In this blog post, I will focus on two recent midterm elections: the 2014 and 2018 House of Representatives elections.
Vote Share Margin by State: 2018
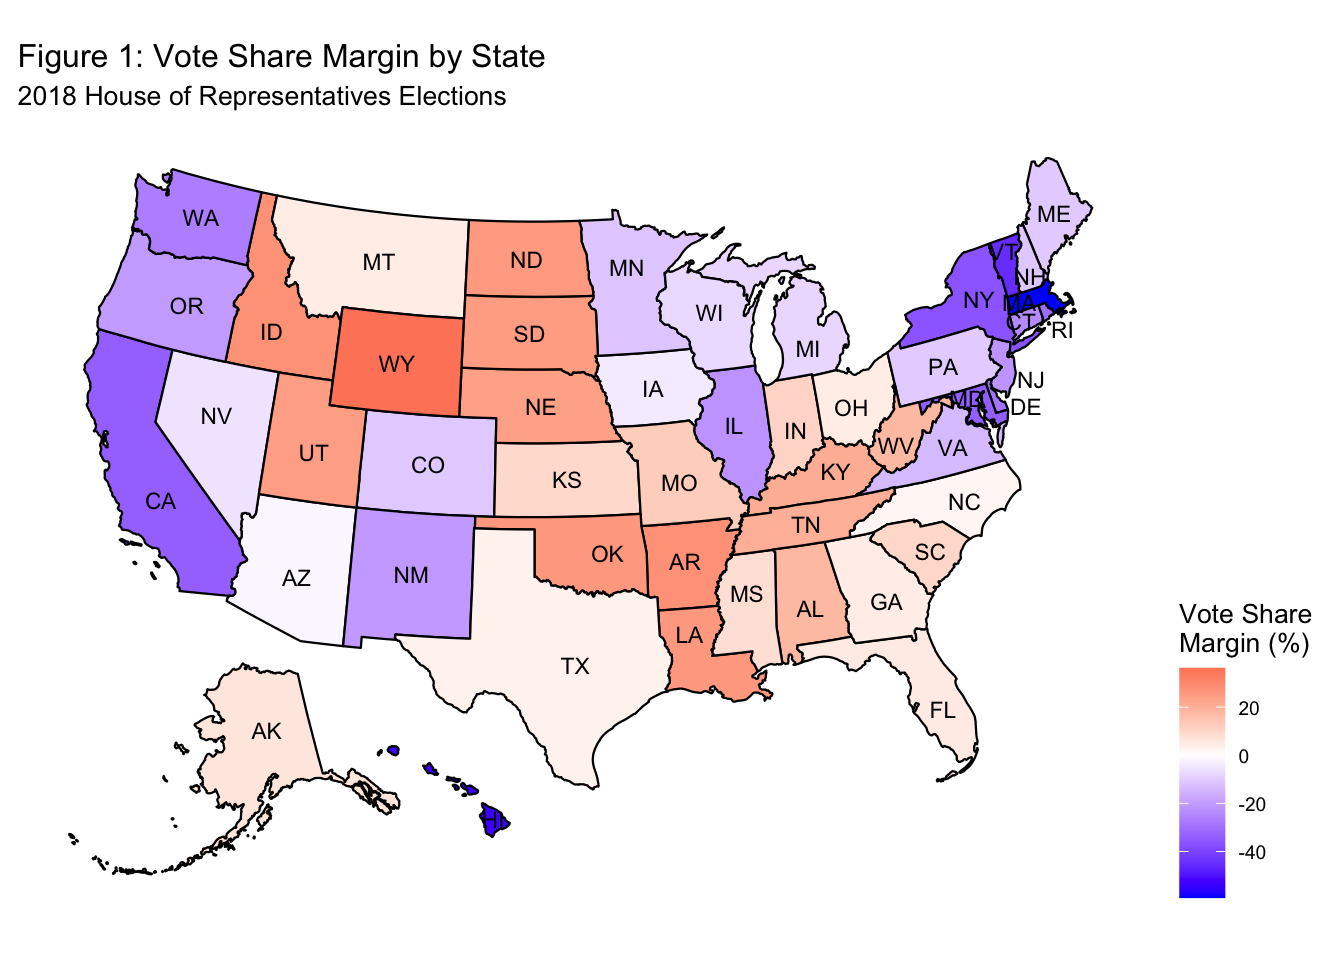
It is well known that the president’s party tends to lose seats in the House in a midterm election. The president’s party lost House seats in 26 out of the 29 midterm elections since 1900, and the 3 exceptions, the 1934, 1998, and 2002 elections, all took place at a time when the incumbent president was exceptionally popular (Franklin Roosevelt, Bill Clinton, and George W. Bush, respectively) (Campbell, 2018a, p. 1). Not surprisingly, in 2018, various models predicted that the Democrats would take back the House (Abramowitz, 2018; Campbell, 2018b, Lewis-Beck & Tien, 2018).
Indeed, Democrats won 235 seats, gaining 41 seats. Figure 1 shows the two-party vote share margin by state. Democrats won the popular vote in 25 states and had an extremely large vote share margin in states with large urban populations such as California, New York, and Massachusetts.
Vote Share Margin: 2014
Vote Share Margin by State
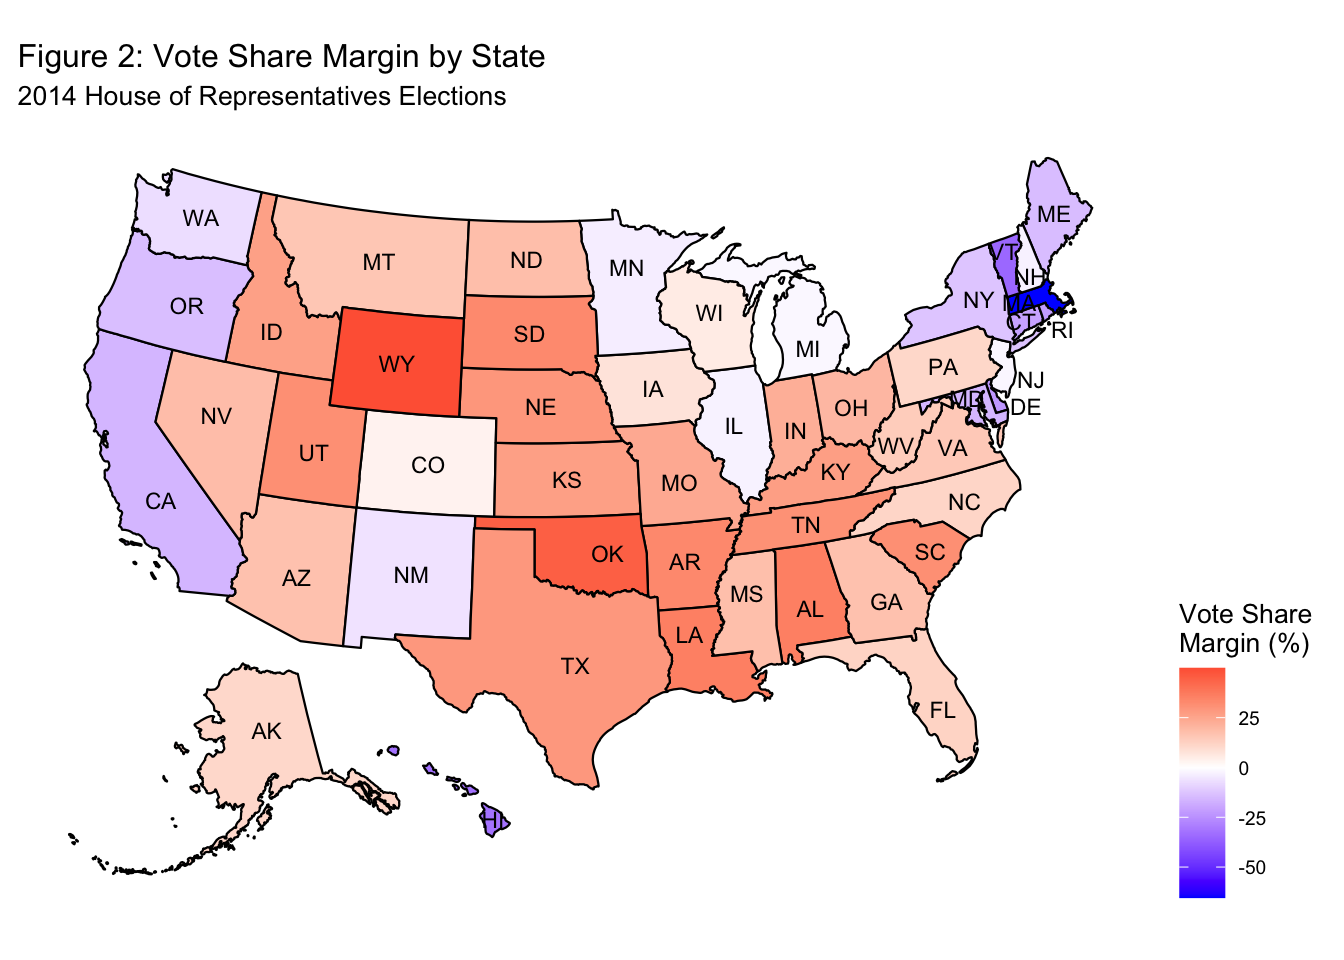
In a similar vein, under then-incumbent President Obama, Democrats struggled in the 2014 midterm elections. Similar to Figure 1, Figure 2 shows the two-party vote share margin by state, and comparing the two reveals some interesting findings. There were 7 states (Arizona, Colorado, Iowa, Nevada, Pennsylvania, Virginia, and Wisconsin) where Republicans won the popular vote in 2014 but lost the popular vote in 2018. There were no states where the Republicans lost the popular vote in 2014 but won the popular vote in 2018. While further analysis is needed to determine which states best fit the characteristics of a swing state, it is possible that those 7 states could be swing states that are worth keeping an eye on in the upcoming elections.
Vote Share Margin by Congressional District
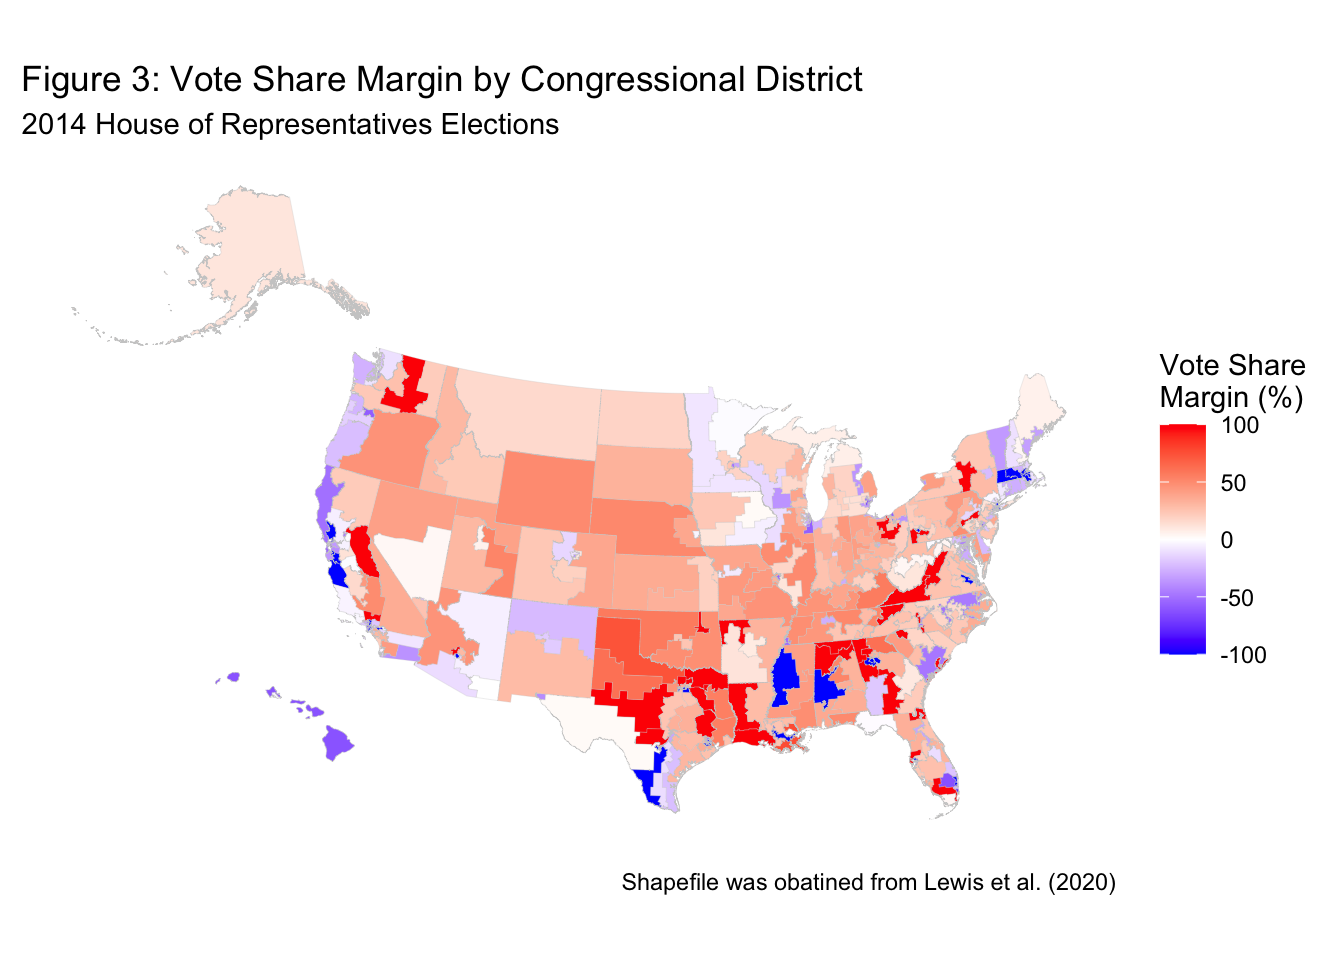
Of course, the vote shares at the state level do not directly determine the outcomes of House elections, so Figure 3, which shows the two-party vote share margin by congressional district in the 2014 elections, may be more informative. Note that the vote share margin is 100% in some districts because some candidates were unopposed by major candidates. Even after dropping those districts, we can see that the vast majority of candidates won by a sizable margin, which suggests that that the majority of seats were safe seats. Highly competitive districts are colored in white since the vote share margin is close to 0%, but there are few of them. Another takeaway is that the districts where Democrats won tended to be geographically small, which reflects the fact that Democrats tend to perform well in urban areas.
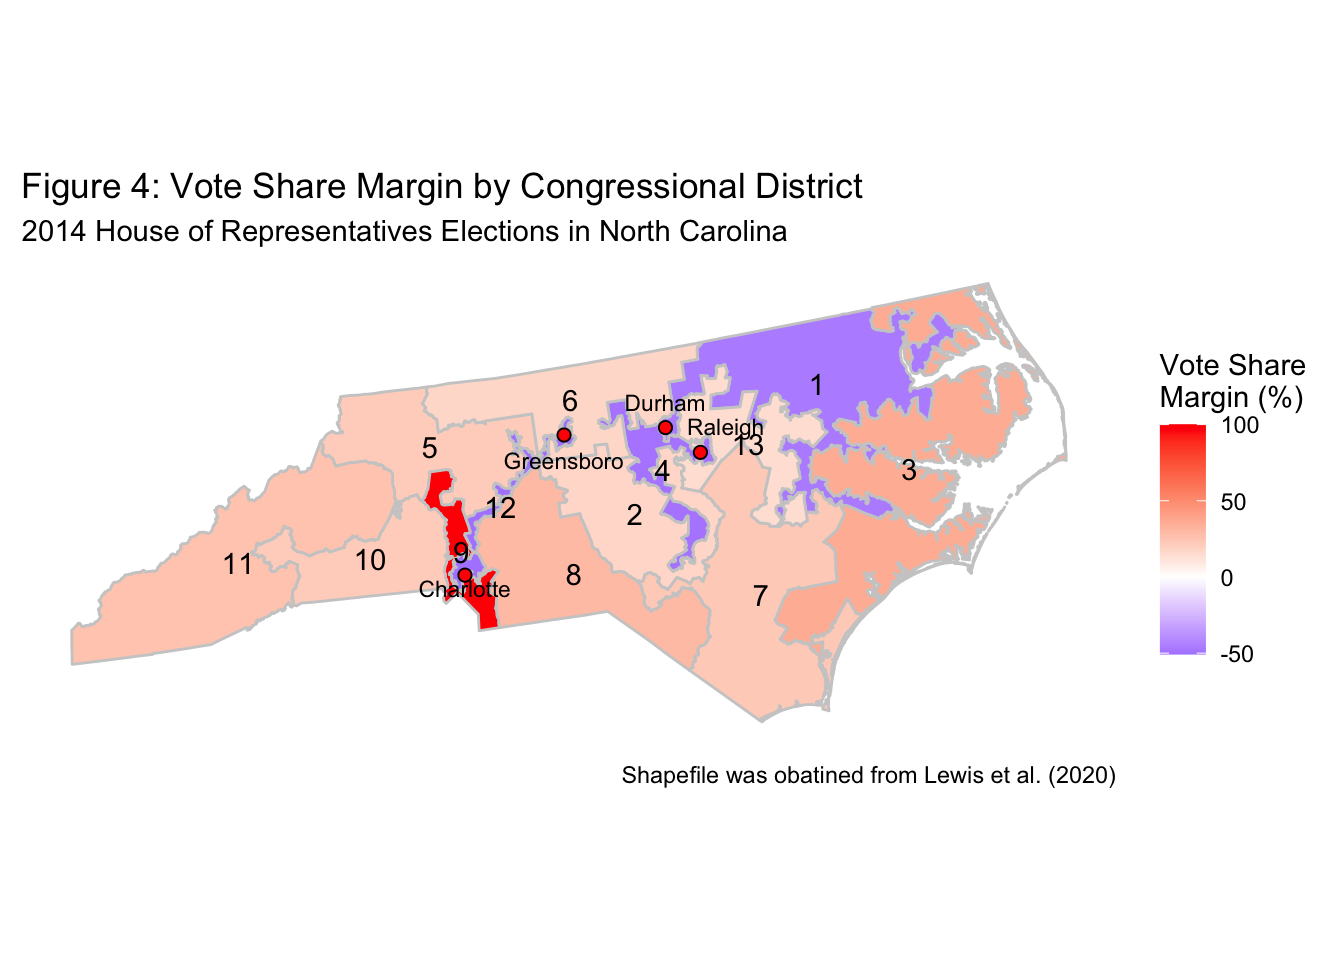
Example: North Carolina
Since there is a limit to what a nation-wide map can tell us, I decided to take a closer look at a state that may give us insights into Democratic voters’ geographic distribution and its relation to redistricting. As Figure 4 shows, in the 2014 House elections, Democrats won 3 seats out of 12, winning by large margins in Districts 1, 4, and 12. Those three districts seem to have been designed to include the largest cities in the State, and they were one of the least geographically compact districts act the time (Ingraham, 2014). Indeed, in 2016, the maps were ordered to be redrawn on the grounds that they were racially gerrymandered. District 1, which encompasses the black neighborhoods of Durham, and District 12, which stretches between Charlotte and Greensboro, were both determined to have been racially gerrymandered, and the decision was upheld by the Supreme Court in 2017 (Barnes, 2017; Hurley, 2017).