03-Polling
The Generic Ballot
Studies have suggested that when combined with a few other variables, the generic ballot can help predict the outcomes of House elections. Prior to the 2018 midterm elections, Abramowitz (2018) used a simple model with three variables (the generic ballot, the president’s party, and the number of seats that each party held before the election) and predicted that if Democrats maintained their early lead in the generic ballot, they would gain about 30 seats. In reality, the Democrats gained 41 seats. Similarly, based on the generic ballot and the fact that the incumbent president was a Republican, Bafumi et al. (2018) predicted that Democrats would gain 53.6% of the two-party vote. In fact, the Democrats won 54.4% of the two-party vote.
Considering the fact that the generic ballot has been proven to be a decent predictor of House elections, this week, I will include in the model the results of the generic ballot polls.
Pollster Quality
When interpreting polls, we should take into account how reliable each poll is. Table 1 shows the ratings of pollsters determined by FiveThirtyEight. When determining these ratings, FiveThirtyEight considers factors such as how accurate each pollster has been in the past, whether the poll is partisan, how a pollster’s forecast have compared against other polls, and the extent to which pollsters are influenced by other pollsters (Silver, 2014).
As seen in Table 1, pollsters with high ratings tend to have a low simple average error, which is the difference between the poll and the actual election result. Note that the magnitude of the simple average error does not perfectly correlate with the ratings. This could be because FiveThirtyEight also takes into account other metrics such as the difference between the poll’s error and the predicted error (Silver, 2014).
| Table 1: Variation in Pollster Ratings (FiveThirtyEight) | ||||
| Rating | Count | Races Called Correctly | Simple Average Error | Pollster |
|---|---|---|---|---|
| A+ | 6 | 0.78 | 4.25 | Marist College, Monmouth University, ABC/Washington Post |
| A | 3 | 0.81 | 4.70 | Survey USA, Suffolk University, CBS/NYT |
| A- | 5 | 0.80 | 5.04 | Emerson College, Siena College, Fox/Beacon/Shaw |
| A/B | 47 | 0.85 | 4.53 | University of Cincinnati (Ohio), LA Times, Georgetown University (Battleground) |
| B+ | 7 | 0.81 | 4.87 | Mason-Dixon, Quinnipiac University, CNN/Opinion Research Group |
| B | 6 | 0.75 | 5.15 | Public Policy Polling, YouGov, American Research Group |
| B- | 6 | 0.81 | 6.27 | Opinion Savvy/InsiderAdvantage, University of NH, Ipsos |
| B/C | 301 | 0.77 | 6.38 | RT Strategies, Tarrance Group, Pew Research Center |
| C+ | 2 | 0.78 | 5.35 | Rasmussen Reports/Pulse Opinion Research, Zogby Interactive/JZ Analytics |
| C | 5 | 0.72 | 5.50 | Harris Insights & Analytics, Gravis Marketing, We Ask America |
| C- | 4 | 0.72 | 6.10 | Mitchell Research & Communications, Change Research, Trafalgar Group |
| C/D | 47 | 0.68 | 10.80 | ccAdvertising, McLaughlin & Associates, Critical Insights |
| D+ | 2 | 0.90 | 4.70 | Lucid, Google Surveys |
| D- | 2 | 0.81 | 9.55 | SurveyMonkey, Swayable |
| F | 10 | 0.82 | 5.42 | Research 2000, Strategic Vision LLC, TCJ Research |
In addition to these ratings, FiveThirtyEight weighs polls based on the poll’s recency and the sample size, and it uses an algorithm to determine the exact magnitude of the weights (Silver, 2022). For this blog post, I decided to weigh the results of generic ballot polls based on how close the poll was conducted to election day. Since polls tend to converge to a point close to the actual outcome only right before the election, I calculated the weighted average of generic polls, giving more weights to polls were conducted near election day (Gelman & King, 1993). The weights assigned to each poll is (365 – number of days the poll was conducted before election day). Note that I dropped the results of generic polls conducted prior to the election year (i.e. odd-numbered years). Ideally, I would have liked to take into account the pollsters’ ratings, but this was impossible because the data I used includes polls that were conducted in the 1940s, which makes it difficult to determine the reliability of the polls. This is one major limitation of my model.
Models
In Table 2, I compare the model that only takes into account economic variables with models that take into account the generic ballot. Model (1) is the same as Model (C) from last week’s blog, and the variables are gross domestic product (GDP) growth between Q6 and Q7, unemployment in Q7, and whether the election is a midterm election. In Model (2), I incorporate the generic ballot. Inspired by Abramowitz (2018), in Models (3) and (4), I include the president’s party’s vote share in the previous election. Lastly, Model (5) is exclusively based on the generic ballot as well as whether the election is a midterm election.
Not surprisingly, the generic ballot seems to be a significant predictor of the president’s party’s two-party vote share, as seen in Model (2). Comparing Model (1) with Model (2), we can see that the adjusted R-squared drastically improved from 0.197 to 0.654. Interestingly, the adjusted R-squared is even higher for Model (5), the model that excludes economic variables, which suggests that the generic ballot alone is a strong predictor of electoral outcomes. Model (3) and Model (4) suggest that the president’s party’s vote share in the previous election is not a significant variable.

Does Model (5) suggest that the economic variables do not matter? I would argue otherwise. I believe that people’s perceptions of the economy affect how they respond to generic ballot polls. Indeed, there is a positive correlation between GDP (Q7-Q6 growth) and the generic ballot (Correlation coeffcient: 0.36, p-value: 3.1e-02)
Model Testing
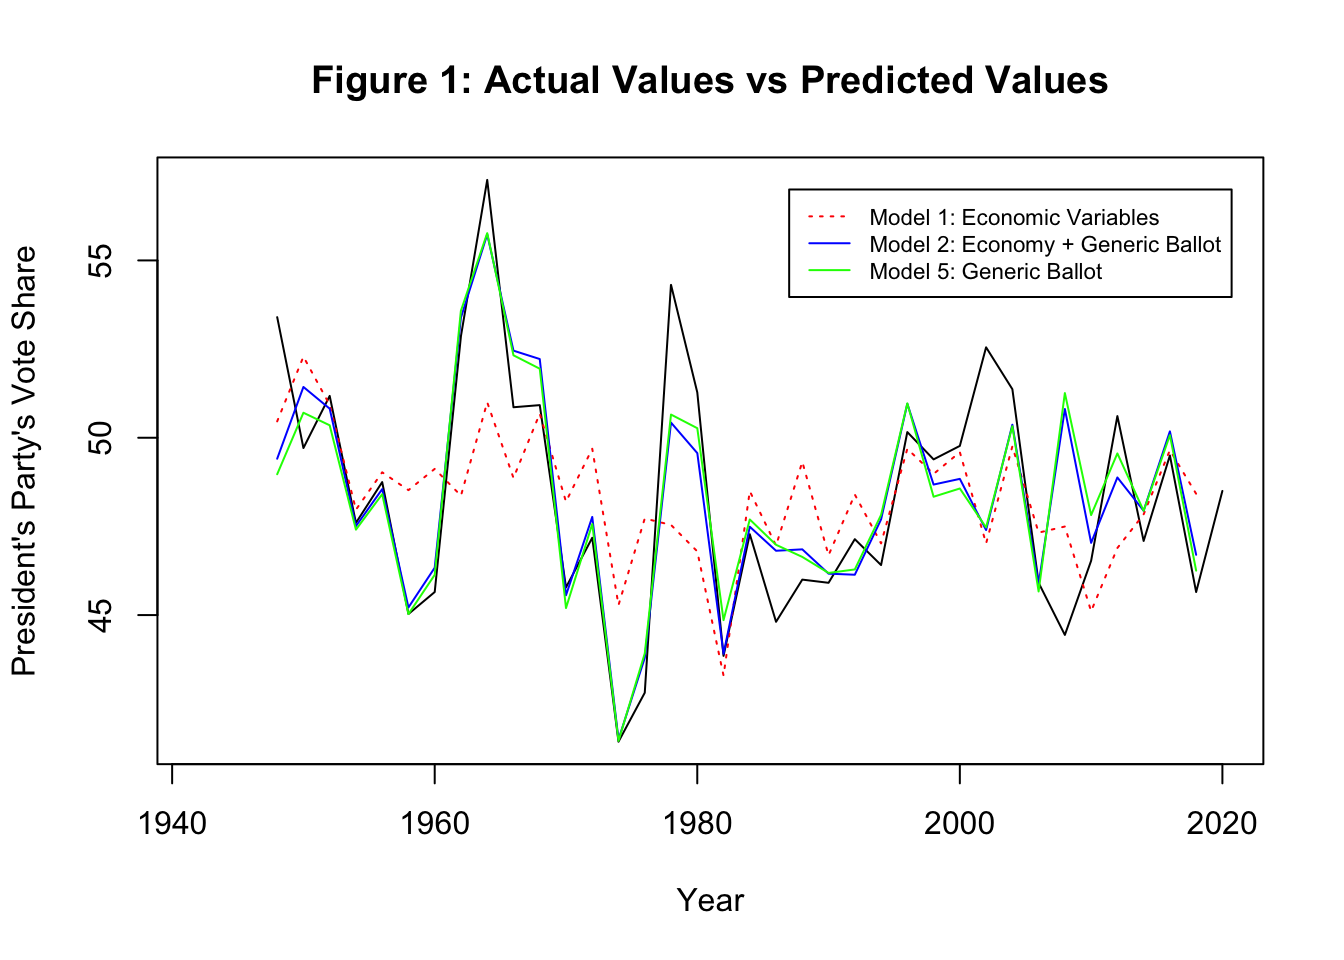
Models (2) and (5), which take into account the generic ballot, clearly seem to fit the data better than Model (1), which is based exclusively on economic variables. As seen in Figure 1, compared with Model (1), the predicted values based on Models (2) and (5) seem to more close to the actual values. Indeed, the root mean squared error (RMSE) of Model (1) is 2.932, while RMSE of Models (2) and (5) are 1.893 and 1.927, respectively.
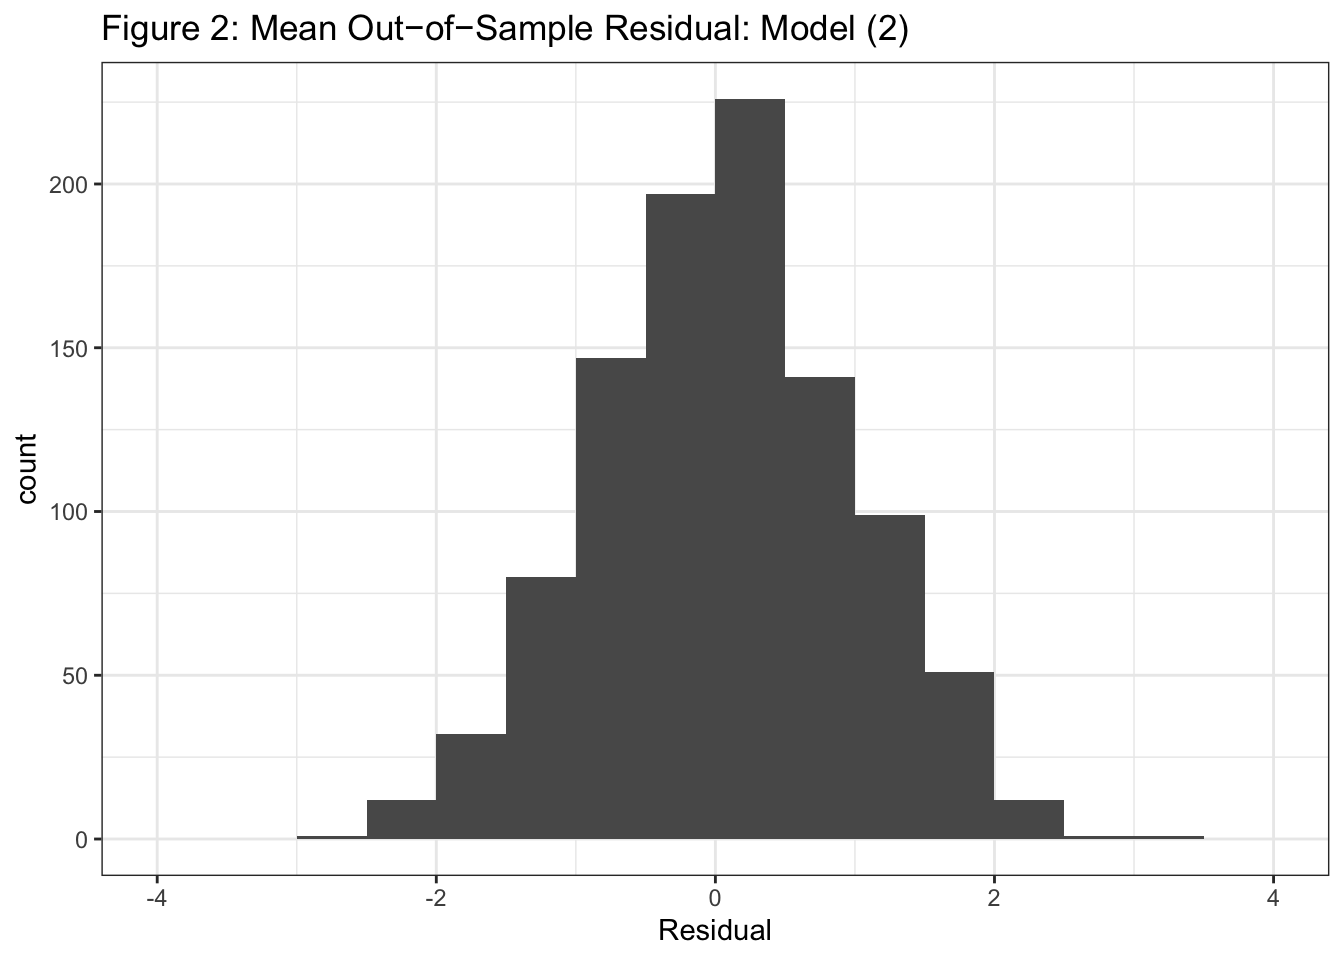
As seen in Figure 2, when I ran 1000 runs of cross-validation for Model (5) by randomly holding out 8 observations in each iteration, I observed that the mean out-of-sample residuals tended to be around -1 to 1.
Prediction
Democrats and Republicans are neck-and-neck in terms of their performance in generic ballot pollsc conducted in 2022. After adjusting for the poll’s recency, Democrats are supported by 43.7% while Republicans are supported about 44.0%. Note that the averages were weighted based on the recency of the polls. Based on this information as well as the economic variables that I used in last week’s blog post, Model (2) suggests that Democrats will gain about 43.88% of two-party vote. Model (5) predicts similar outcomes. Interestingly, compared to Model (1), both Models (2) and (5) seem to predict a more favorable outcome for Democrats, which suggests that there is a chance that Democrats could perform better than expected despite the economic conditions that favor the Republicans.
| Table 3: Model Testing and Prediction for 2022 | |||||
| Model | Model Evaluation | Predictions | |||
|---|---|---|---|---|---|
| Adjusted R-squared | RMSE | Fitted | Lower | Upper | |
| 1: Economic Variables | 0.1969 | 2.932 | 47.85 | 41.02 | 54.68 |
| 2: Economy + Generic Ballot | 0.6545 | 1.893 | 48.37 | 43.88 | 52.86 |
| 5: Generic Ballot | 0.6636 | 1.927 | 48.13 | 43.92 | 52.34 |
References
Abramowitz, A. (2018). Will Democrats Catch a Wave? The Generic Ballot Model and the 2018 US House Elections. PS: Political Science & Politics, 51(S1), 4-6. doi:10.1017/S1049096518001567
Bafumi, J., Erikson, R., & Wlezien, C. (2018). Forecasting the 2018 Midterm Election using National Polls and District Information. PS: Political Science & Politics, 51(S1), 7-11. doi:10.1017/S1049096518001579
Gelman, A., & King, G. (1993). Why Are American Presidential Election Campaign Polls So Variable When Votes Are So Predictable? British Journal of Political Science, 23(4), 409–451. https://doi.org/10.1017/S0007123400006682
Silver, N. (2014, September 25). How FiveThirtyEight calculates pollster ratings. FiveThirtyEight. https://fivethirtyeight.com/features/how-fivethirtyeight-calculates-pollster-ratings/
Silver, N. (2022, June 30). How FiveThirtyEight’s House, Senate and governor models work. FiveThirtyEight. https://fivethirtyeight.com/methodology/how-fivethirtyeights-house-and-senate-models-work/