05-The 'Air War'
In addition to incumbency, the strength of candidates’ campaigns has an impact on electoral outcomes. In this blog post, I will predict the outcomes at the district level, taking into account three district-level variables: expert ratings, incumbency, and the volume of ads.
Incorporating District-Level Information
Two-Step Forecasting Model
Similar to Bafumi et al. (2018), my model is made up of two steps. First, I predict the Democratic popular vote share and run 3,000 simulations to obtain a set of possible outcomes at the national level. Second, I build a model to see how the national-level vote share translates into district-level vote share. I calculate how each of the 3,000 simulated popular vote share translates into district-level vote share and predict the number of seats that the Democrats will win.
I adopt this method instead of building a single model that incorporates district-level variables because it allows us to take into account redistricting. Relying on historical data at the district level can be problematic in districts where the dynamics have shifted greatly due to redistricting. For example, in California’s 22nd District, which is the district I have been monitoring throughout the semester, used to be a Republican-leaning district but became Democratic-leaning after redistricting. In such districts, relying on historical data to build a district-level forecast model is not realistic. My method addresses that issue by predicting the national-level vote share first and translating that into district-level vote shares. I use data from the 2018 House elections to see how the national-level vote share generally tends to translate into district-level vote share.
National-level Prediction
My forecast model for the popular vote share is similar to the models I built in Blog Post 03. As seen in Table 1, I predict the president’s party’s two-party popular vote share based on the GDP growth rate between the 6th quarter and 7th quarter, whether the election is a midterm election, and the president’s party’s performance in generic ballot polls. The generic ballot polls are weighted based on recency.

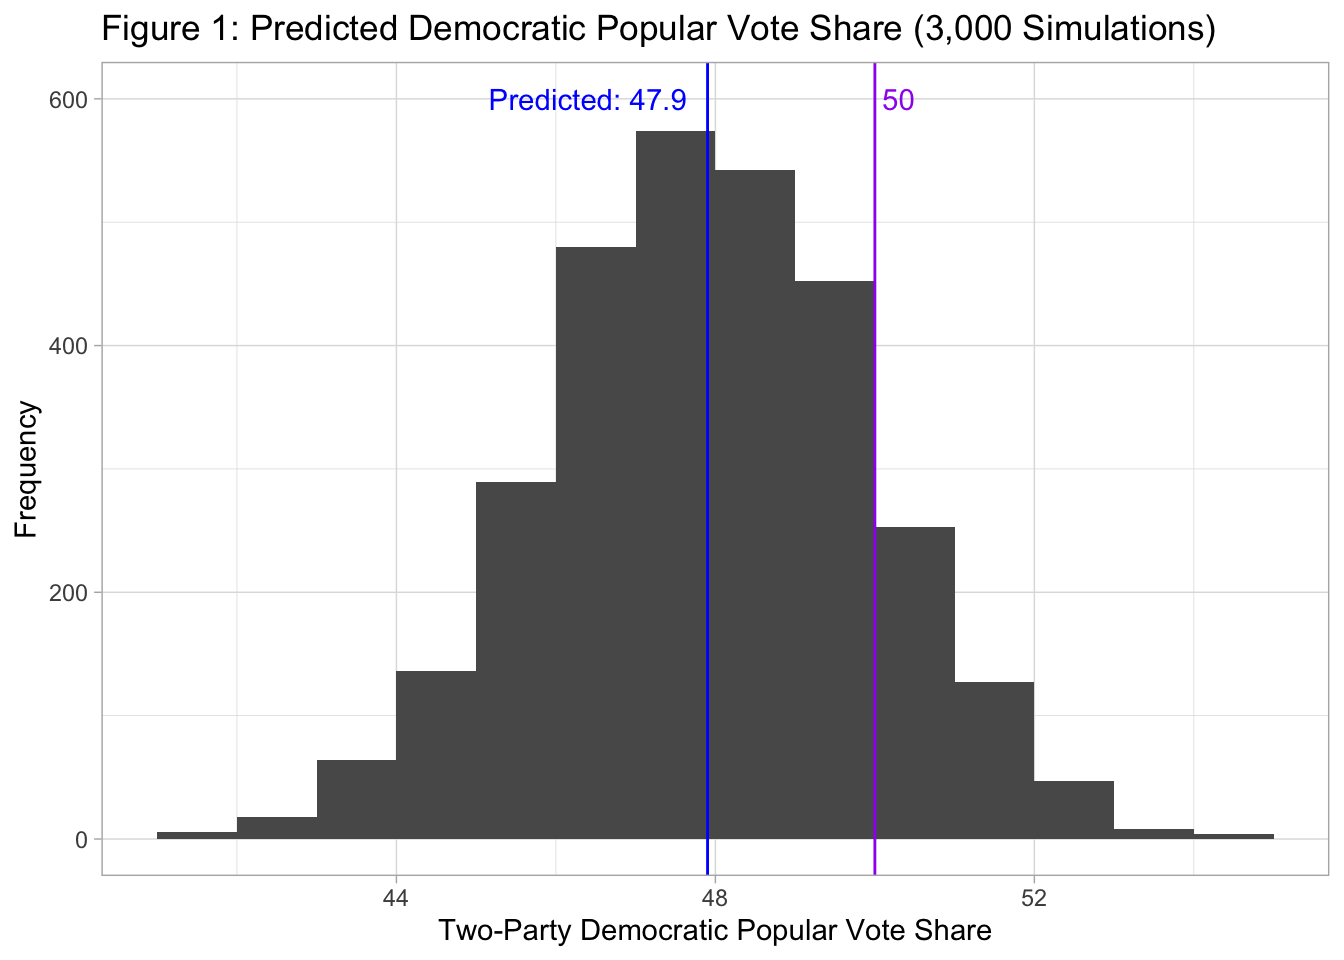
Using this model, I run simulations to predict the Democratic popular vote share in 2022, thereby obtaining a set of 3,000 potential outcomes at the national level. The simulations are based on the assumption that the errors of the model are normally distributed, with the mean being 0 and the standard deviation being equal to the residual standard error of the model. As seen in Figure 1, the most likely outcome in 2022 is for the Democrats to win 47 to 48% of the two-party popular vote.
District-Level Prediction
Incorporating Ads Data
Next, relying on data from the 2018 elections, I build a model to see how the popular vote share translates into district-level vote shares. The dependent variable is district-level Democratic vote share relative to the Democratic popular vote share. (For example, if a candidate won 60% of the two-party vote in a certain district, we can say that they won 1.10 times the Democratic popular two-party vote share, which was 54.35% in 2018). The independent variables are:
- Expert rating: the average of the ratings from the Cook Political Report, Inside Elections, and Sabato’s Crystal Ball. The ratings were converted into a 7-point scale, with 7 being “Solid/Safe Democrat,” 4 being “Toss-up”, and 1 being “Solid/Safe Republican.” The data was retrieved from Ballotpedia (2018).
- Ads (Dem %): Percentage of TV ads aired in the district by the Democratic candidate. In districts where there were no TV ads, the value is held at 50%, assuming that neither campaign had an advantage in that district.
- Incumbency: 1 if the Democratic candidate was an incumbent.

Note that ads seem to have a weak and significant effect. While this result may be counterintuitive given the evidence that voters are actually persuaded by TV ads (Huber & Arceneaux, 2007), it makes sense when considering the fact that both parties strategically air ads in competitive districts. Campaigns may end up losing races despite investing in TV ads because the race was competitive.
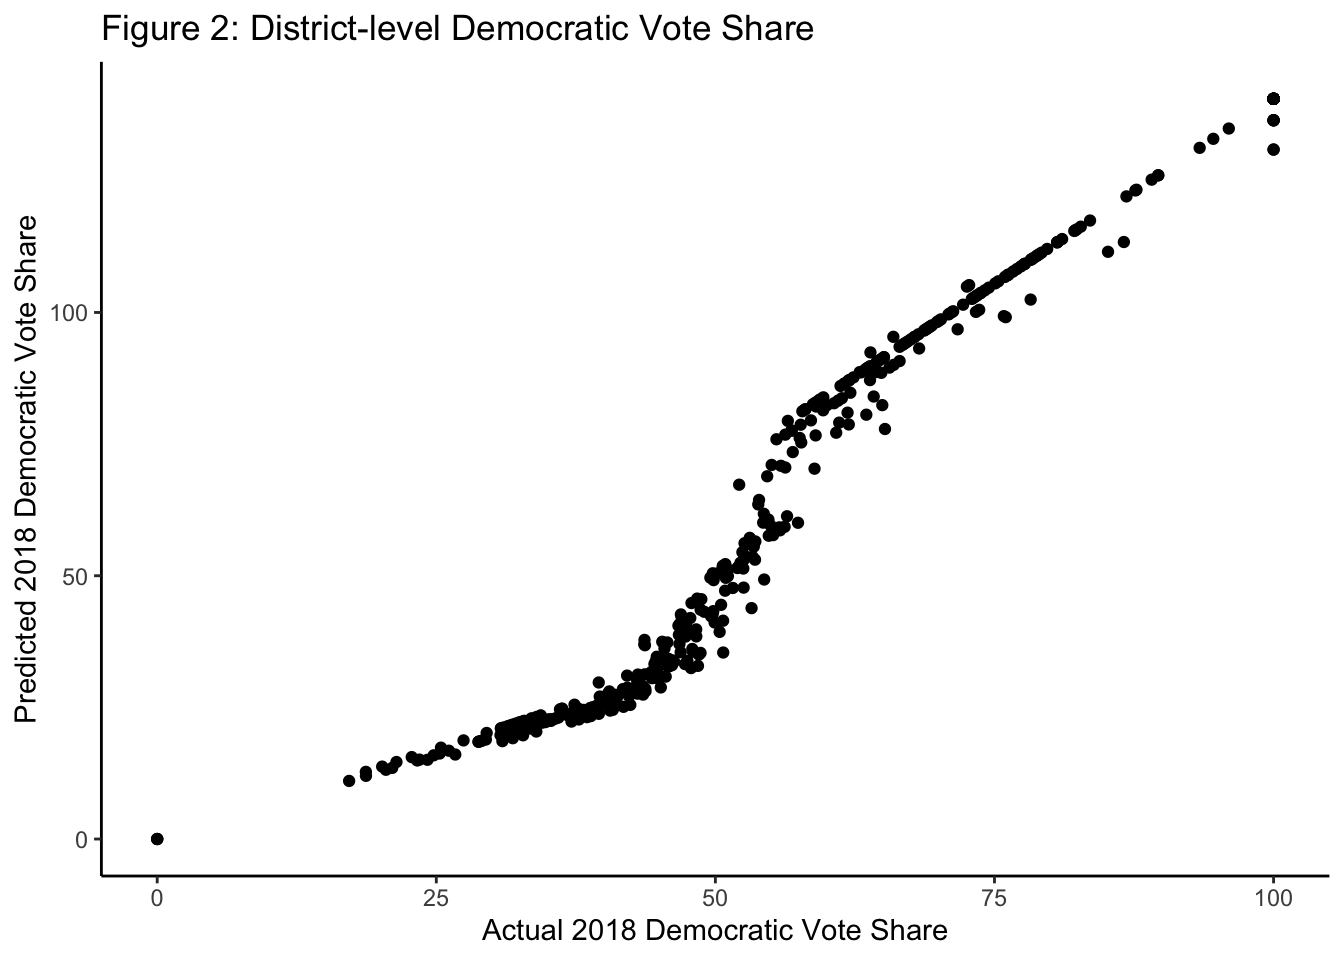
In Figure 2, I plotted the predicted Democratic vote share based on this model against the actual vote share in 2018. The predicted vote shares exceed 100 in some districts, which shows the limitation of this model. However, the model correctly predicted the outcomes of 423/435 races, which suggests that the model may be good enough if we are only interested in who wins the race.
Predicted Number of Democratic Seats
Lastly, I use this model to predict the number of seats that the Democrats will win in 2022. Using the model shown in Table 2, I translate each of the 3,000 potential Democratic vote shares into district-level vote share based on the latest data. The data on expert ratings was retrieved from Ballotpedia (2022), and the data on incumbency was retrieved from the Cook Political Report (2022) and Ballotpedia (2022). The data on the volume of TV ads was retrieved from the data that was compiled by Kantar/CMAG and analyzed by the Wesleyan Media Project (2022). This dataset shows the volume of TV ads aired between September 19 and October 2 in 53 House districts. Note that there will likely be more ads between now and voting day, and one party might gain an advantage over the other closer to voting day. We can expect that campaigns will strategically air more ads closer to voting day since the effect of TV ads are short-lived (Gerber et al., 2011)
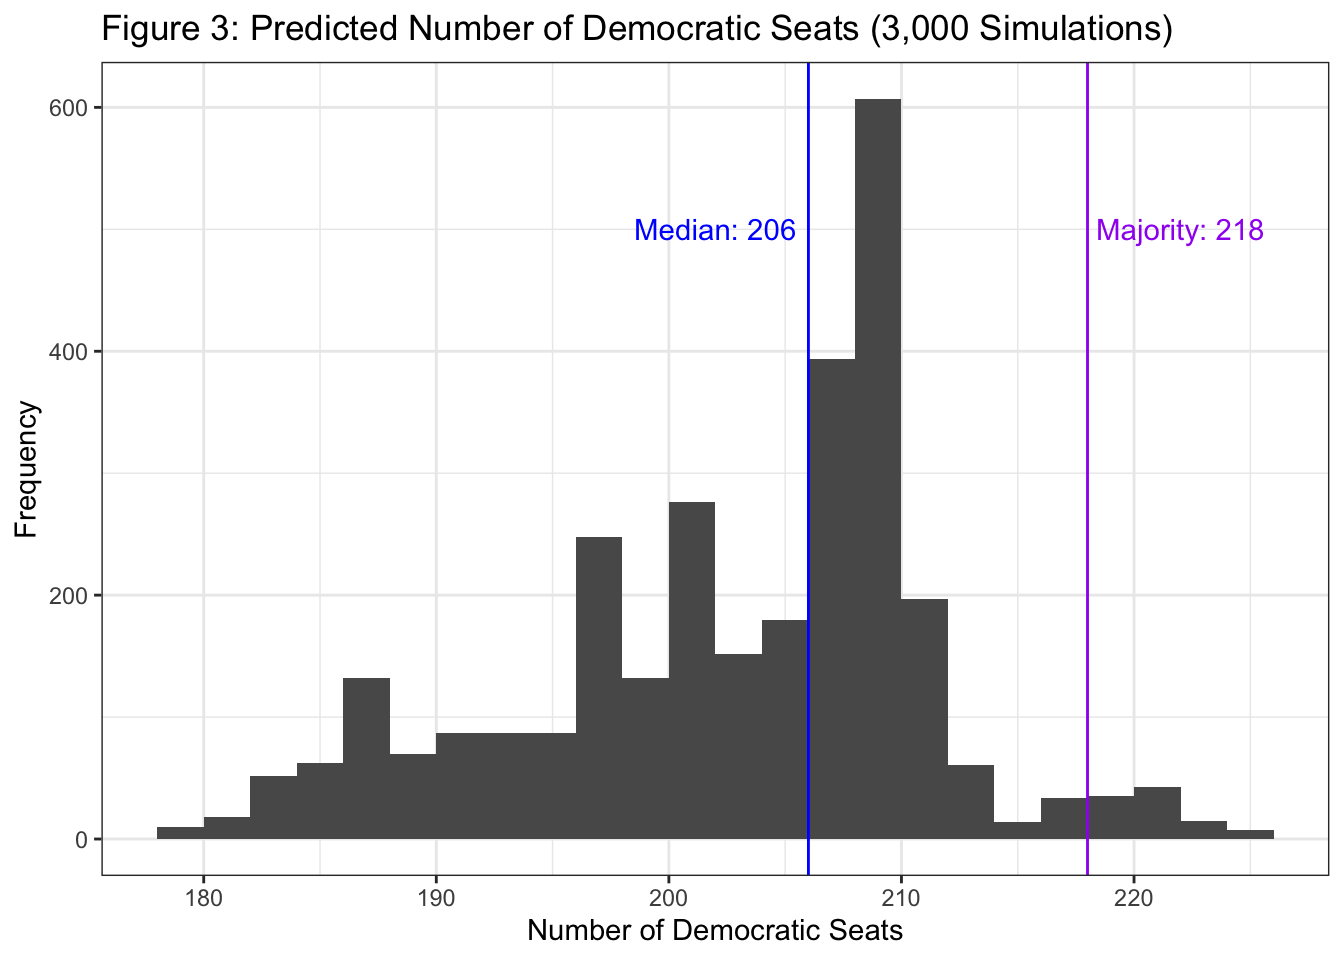
As seen in Figure 3, the median of the predicted number of Democratic seats is 206, and Democrats are highly unlikely to win the majority. The predicted Democratic seat share (47.4%) ended up being close to the predicted Democratic popular vote share (47.9%).
References
Bafumi, J., Erikson, R., & Wlezien, C. (2018). Forecasting the 2018 Midterm Election using National Polls and District Information. PS: Political Science & Politics, 51(S1), 7-11. doi:10.1017/S1049096518001579
Ballotpedia. (2018). United States House of Representatives elections, 2018. https://ballotpedia.org/United_States_House_of_Representatives_elections,_2018
Ballotpedia. (2022). United States Congress elections, 2022. https://ballotpedia.org/United_States_Congress_elections,_2022
Cook Political Report. (2022). PVI Map and District List. https://www.cookpolitical.com/cook-pvi/2022-partisan-voting-index/district-map-and-list
Gerber, A.S., Gimpel, J. G., Green, D. P., & Shaw, D. R. (2011). How Large and Long-lasting Are the Persuasive Effects of Televised Campaign Ads? Results from a Randomized Field Experiment. American Political Science Review, 105(1), 135–150. https://doi.org/10.1017/S000305541000047X
Huber, G.A. & Arceneaux, K. (2007). Identifying the Persuasive Effects of Presidential Advertising. American Journal of Political Science, 51(4), 957–977. https://doi.org/10.1111/j.1540-5907.2007.00291.x
Wesleyan Media Project. (2022, October 6). Democrats Out-Pacing GOP in Senate Races. https://mediaproject.wesleyan.edu/releases-100622/