06-The 'Ground Game'
Probabilistic Models
In Blog Post 05, I built two models: in the first model, I predicted the popular vote share at the nation level, and in the second model, I predicted how the popular vote at the nation level translates into district-level vote shares. In this blog post, I turn the second model into a probabilistic model.
As I demonstrated in Figure 2 in Blog Post 05, a linear regression model can yield predicted values that lie outside the support (i.e. 0 to 100). Thus, by using a binomial logistic model, I will predict the probability that a voter in a certain district will vote for the Democratic candidate. I use data from the 2012 to 2018 elections, and the independent variables are the following.
- Democratic popular vote share at the national level
- I predict that the national-level Democratic vote share has an impact on the district-level Democratic vote share.
- Expert ratings
- I use this as a proxy for polling data. Polling data is not useful for my model because high-quality polling data is not readily available for most districts, especially for the 2012/2014 elections. Expert ratings are available for every competitive district for all elections between 2012 and 2018.
- For non-competitive districts where ratings were unavailable, I make the assumption that the actual outcome was what the experts had expected before the election. (i.e. If a Democrat won in a district where ratings were not available, I assume that the experts had predicted that the Democratic candidate would handily win). This is a valid assumption because experts focus on the competitive districts, meaning that the districts where experts did not make predictions were safe seats.
- I took the average of the ratings issued by the Cook Political Report, Rothenberg Political Report (Inside Elections), and Sabato’s Crystal Ball. The ratings were converted into a 7-point scale, with 7 being “Solid Republican” and 1 being “Solid Democratic.” Note that this is the opposite of the scale I used for Blog Post 05.
- Democratic TV ads (log of Dem:Rep ratio)
- Whereas I calculated the share of ads run by Democrats in Blog Post 05, in this blog post, I calculate the ratio of Democratic vs Republican ads and take the natural log of it. This is a better approach because in some districts, one campaign overwhelmingly airs more ads than the other campaign. Taking the natural log ensures that we capture this skewed distribution.
- When one campaign ran ads but the other campaign did not, I made the hypothetical assumption that the latter aired one ad. Without this adjustment, the log of the ratio would be infinity.
- When neither campaign ran ads, the variable is held at 0.
- Democratic incumbent
As seen in Table 1, the nation-level Democratic popular vote share and expert ratings have a statistically significant impact on the probability of a Democratic vote. The signs of the coefficients make sense: the better the Democrats perform nationwide, the more likely a voter is to vote for a Democrat in their district. Also, the more favorable the expert ratings are to Republicans, the less likely a voter is to vote for a Democrat in their district. The McFadden’s R-squared is 0.924.

Predictions: Distribution of Outcomes
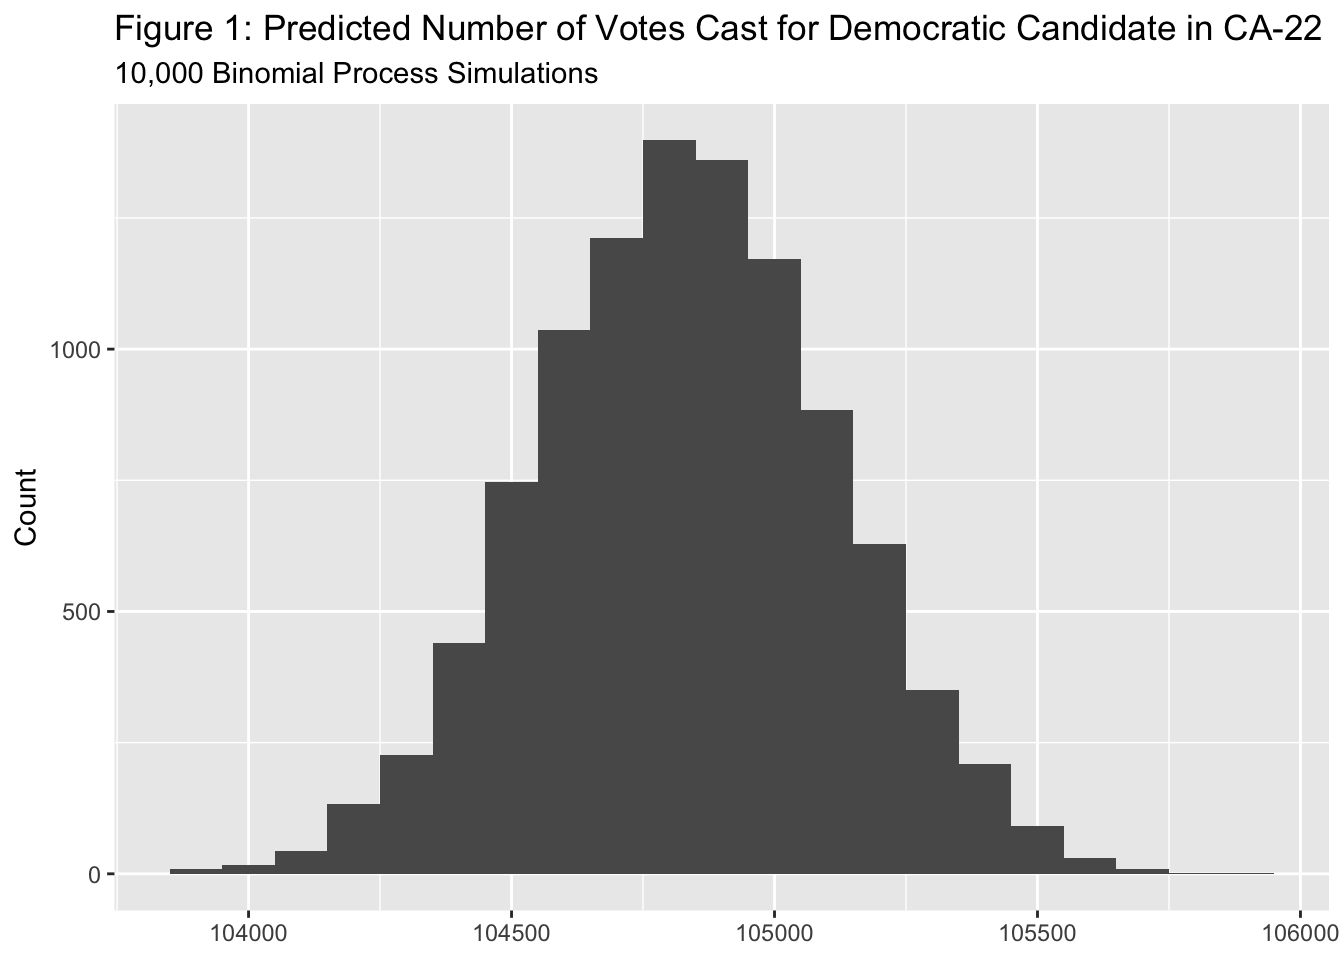
Next, I predicted the probability of a Democratic vote in each district and obtained a distribution of outcomes by hypothetically drawing 10,000 voters from the district’s CVAP.
I used data compiled by Dave’s Redistricting (2022) to calculate the size of the CVAP for each district to better take into account redistricting. While many datasets estimate the size of the CVAP based on the pre-redistricting districts, the data compiled by Dave’s Redistricting (2022) is aggregated to the post-redistricting district-level. I used data compiled by Kantar/CMAG and analyzed by the Wesleyan Media Project (2022) to estimate the number of ads aired in each district, and I used data available on Ballotpedia (2022) to calculate the average of the ratings issued by the Cook Political Report, Inside Elections, and Sabato’s Crystal Ball.
As seen in Figure 1, the predicted number of Democratic votes in California’s 22nd District, where the predicted probability of a Democratic vote is 0.264, shows a degree of variation. This variation may better reflect reality than a point-estimate: campaigning on the ground may increase turnout, especially in highly targeted areas (Darr & Levendusky, 2014; Enos & Fowler 2018).
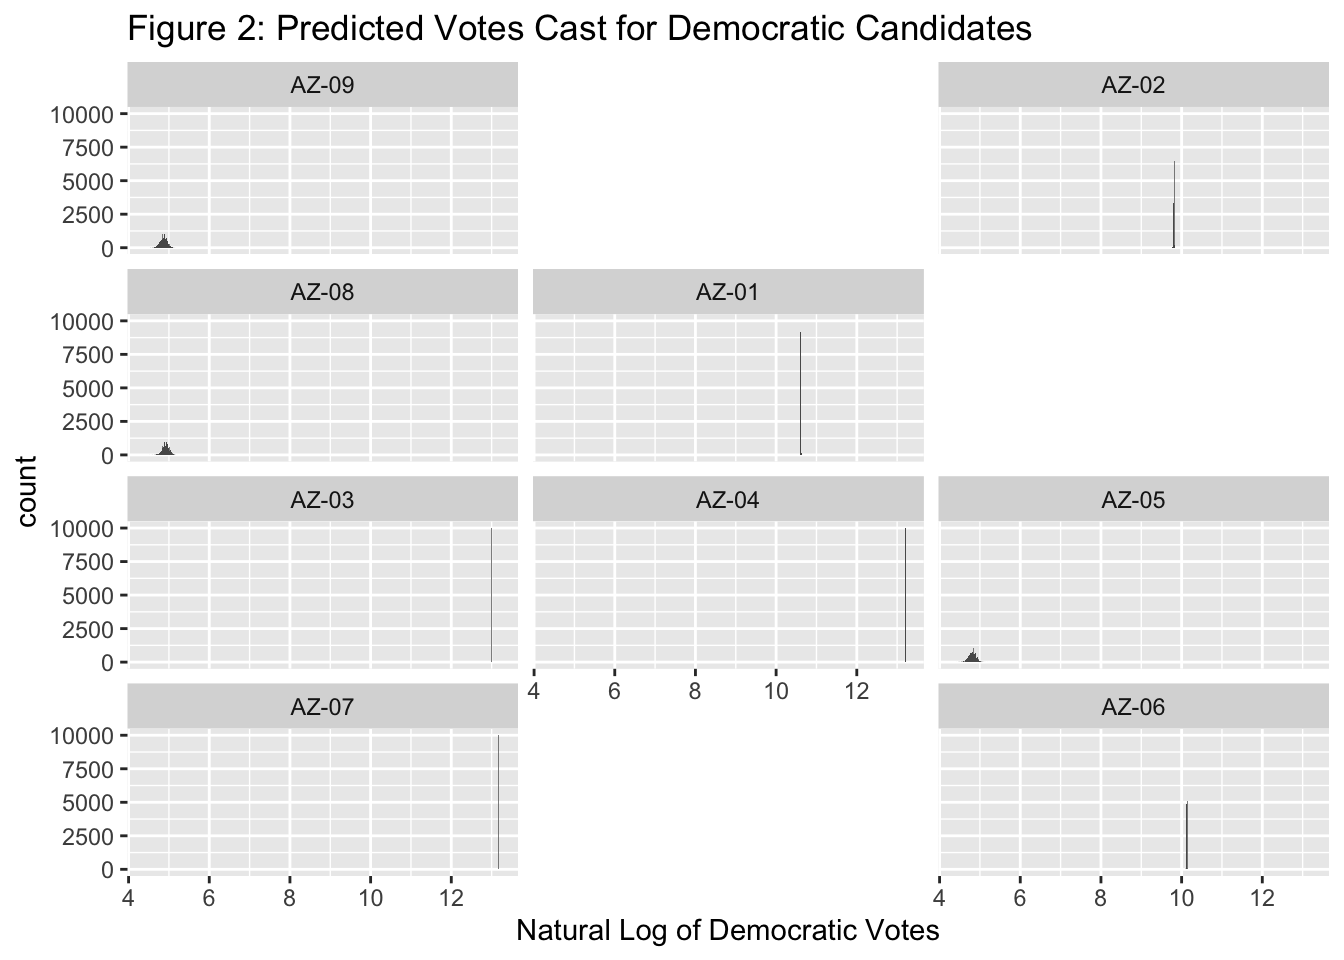
However, overall, the predictions seem to point to the limitations of this model. The geofacet plot showing the predicted number of Democratic votes for the districts in Arizona suggests that my model may not adequately capture the variation in potential outcomes (Figure 2). Even after taking the natural log, the predicted number of Democratic votes clustered in a very small range.
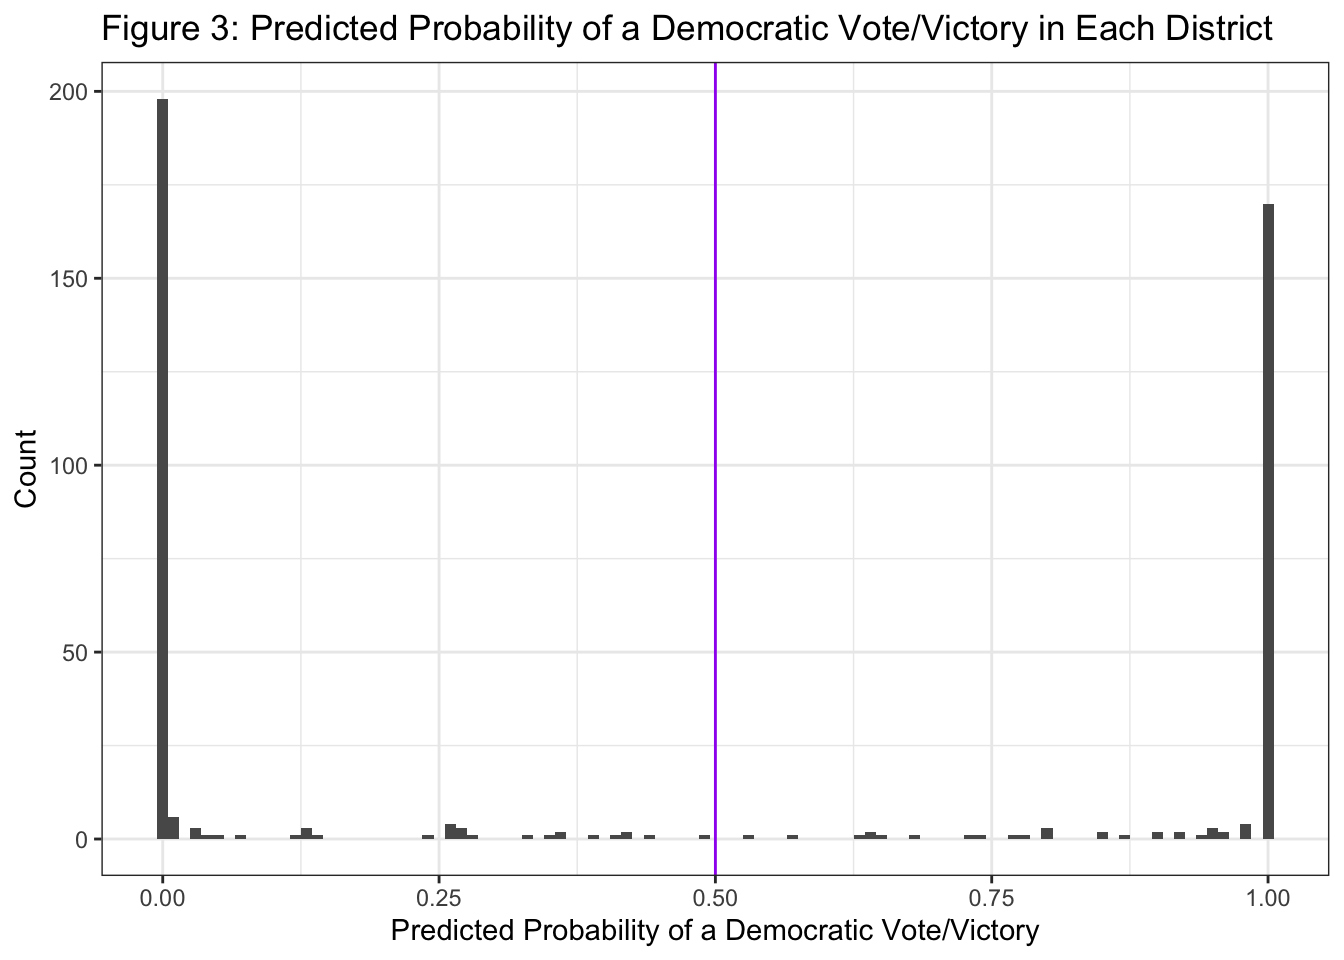
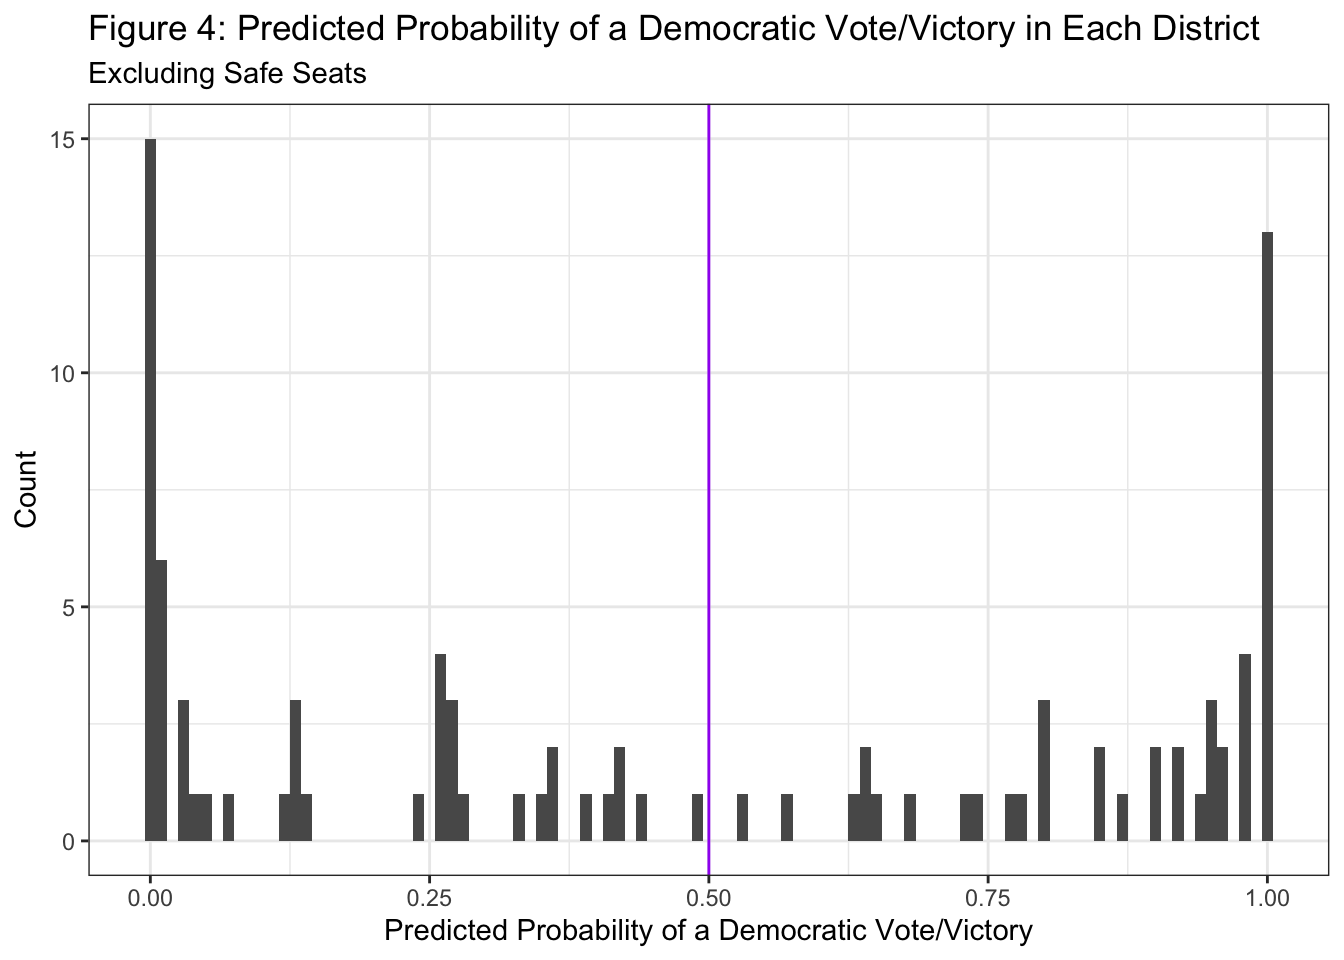
This could be because my prediction is heavily dependent on expert ratings, which are merely averages of a 7-point scale and thus do not have much variation. Alternatively, the lack of variation may simply reflect the fact that most races are not competitive. As seen in Figure 3, the predicted probability of a Democratic victory in most districts is either close to 0 or 1. Even after excluding the predictions for safe seats (the districts where the average of the expert ratings are either 7 or 1), a considerable number of races are expected to have an extremely high chance of a Democratic or Republican victory (Figure 4). Overall, there are 201 districts where the predicted probability of a Democratic vote/victory is over 50%. This is slightly less than 206, which is the median of the prediction based on the model in Blog Post 05.
References
Ballotpedia. (2022). United States Congress elections, 2022. https://ballotpedia.org/United_States_Congress_elections,_2022
Darr, J.P., & Levendusky, M. S. (2014). Relying on the Ground Game. American Politics Research, 42(3), 529–548. https://doi.org/10.1177/1532673X13500520
Dave’s Redistricting. (2022). https://davesredistricting.org/maps#home
Enos, R.D., & Fowler, A. (2018). Aggregate Effects of Large-Scale Campaigns on Voter Turnout. Political Science Research and Methods, 6(4), 733–751. https://doi.org/10.1017/psrm.2016.21
Wesleyan Media Project. (2022, October 6). Democrats Out-Pacing GOP in Senate Races. https://mediaproject.wesleyan.edu/releases-100622/