07-Shocks
In this blog post, I will discuss why a pooled model is more appropriate than fitting a regression for each district, incorporate demographic variables into the model, and simulate a surge among Hispanics in California’s 22nd District.
Method
There are two steps in my prediction model. First, I predict the Democratic two-party vote share and run simulations to obtain 5,000 potential Democratic popular vote shares. Second, I predict how the nation-level vote share translates into district-level vote share. I adopt this approach because fitting a regression for each district by relying on historical data does not work well in districts whose characteristics have changed drastically due to redistricting. In the second part of a model, I fit one regression across all districts to forecast Democratic candidates’ performance relative to the Democrats’ nation-level vote share. This allows us to predict how well Democrats will perform in each district even in cases where the historical data is not predictive of the 2022 elections. For example, California’s 22nd District, the district I am following, used to be a Republican-leaning district prior to redistricting but now is a competitive district. Past data is not useful in this case, but we can rely on data from other districts in the past to forecast how well the Democratic candidate will do in a district whose characteristics are similar to CA-22.
Nation-Level Popular Vote Share
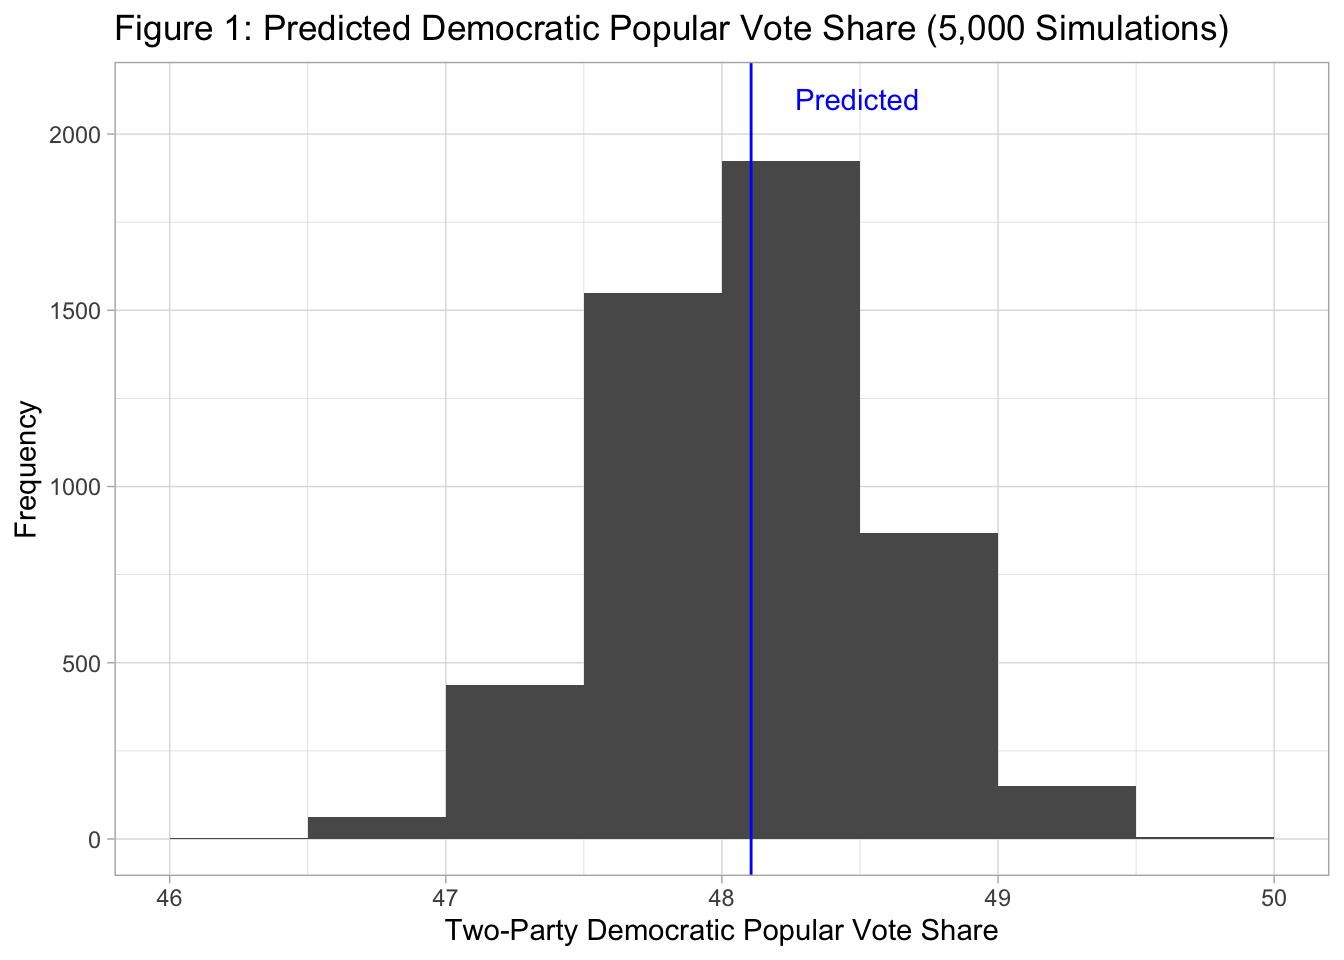
Similar to previous blog posts, I predict the president’s party’s popular vote share based on GDP growth, whether the election is a midterm election, and the generic ballot (Table 1). The results of the generic ballot are weighted based on recency. The predicted Democratic two-party popular vote share for 2022 is 48.11 (Confidence Interval: 43.90, 52.32). I next ran 5,000 simulations based on the assumption that the errors are normally distributed, and as seen in Figure 1, the Democrats were predicted to lose the popular vote in all 5,000 simulations.

How Does the Nation-Level Vote Share Translate into District-Level Vote Share?
The second step of my model is to predict the Democratic candidates’ vote share relative to the national-level Democratic vote share. Polls are useful to forecast district-level vote shares, but since not all districts have high-quality polling, I built one model that does not take into account polls and another model that incorporates polls. As seen in Table 2, the model that does not incorporate polls (Model 2a) suggests that expert ratings, TV ads, incumbency, and demographics all have an impact on the Democrats’ district-level performance. Higher shares of Hispanic, black, and Asian populations all have a positive and significant impact. Note that the negative coefficient on expert ratings makes sense because the ratings are on a 7-point scale, with larger values indicating a more Republican-leaning district. The model that incorporates polls (Model 2b) suggests that a better performance in the polls has a positive and significant impact on the Democrat’s actual performance in the election. Demographic variables do not seem to have a significant impact, which could be because polls are correlated with the district’s characteristics such as demographics.

Surges
Unexpected events can have an impact on elections. For example, voters may punish the incumbent party for damage caused by natural disasters (Healy & Malhotra, 2010). Some argue that voters punish incumbents irrationally for events that are out of the control of politicians such as shark attacks (Achen & Bartels, 2017) although this theory has been challenged by others (Fowler & Hall, 2018).
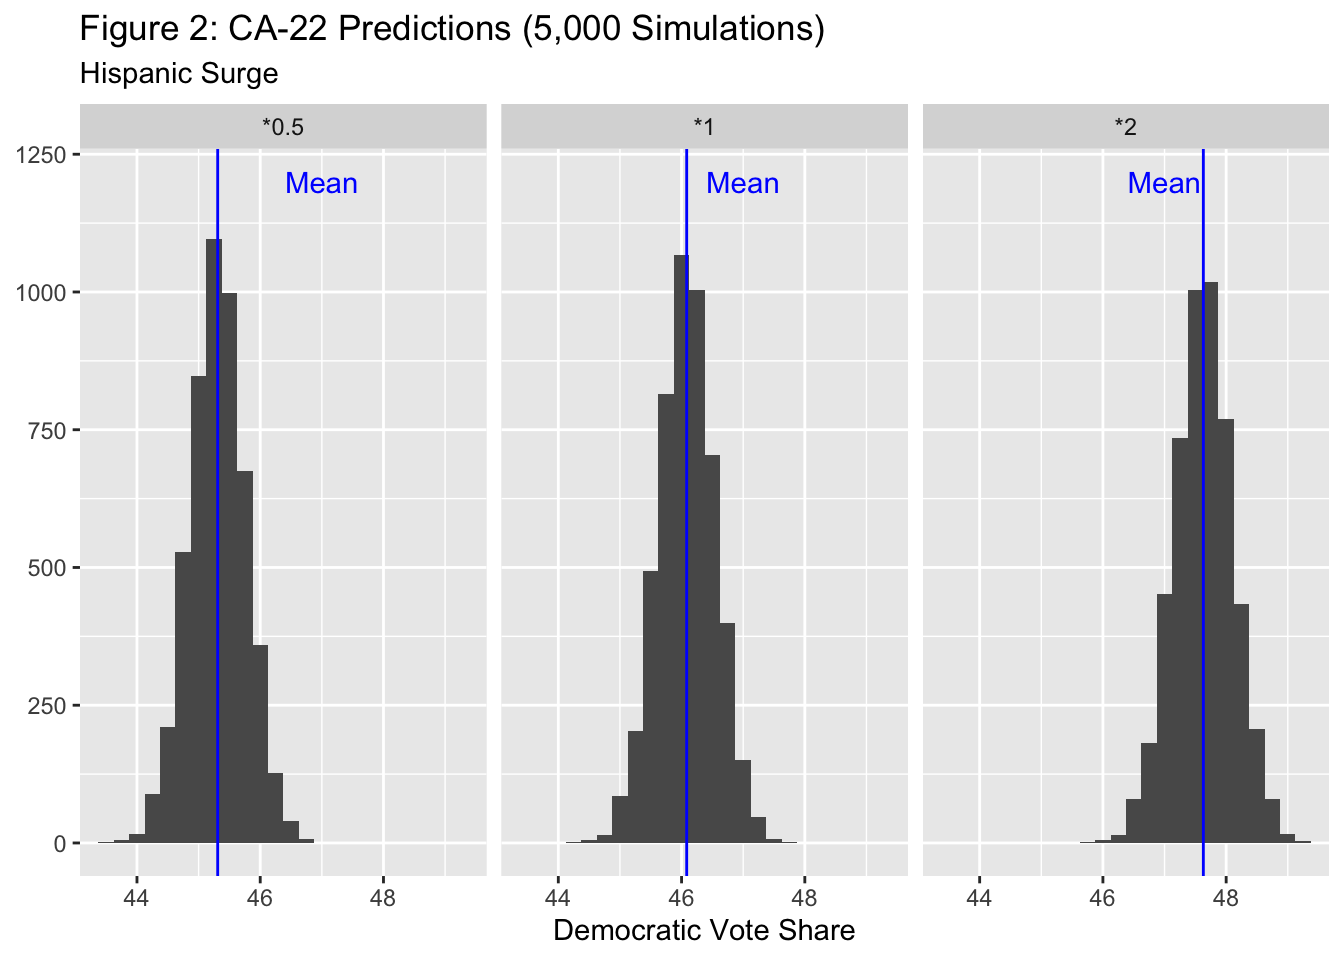
In Figure 2, I simulated how a surge among Hispanics will impact the Democratic vote share in CA-22, where Hispanics account for nearly 60% of the voting-age population (Dave’s Redistricting, 2022). For each of the 5,000 simulated Democratic popular vote share (Figure 1), I used Model 2b (Table 2) to predict how those will translate into the Democratic vote share in CA-22. When I doubled the coefficient on the Hispanic share of the population, the mean of the predicted Democratic vote share rose by more than 1 percentage point. When I halved the coefficient on the Hispanic share of the population, the mean of the predicted Democratic vote share declined by less than 1 percentage point.
Predicted Number of Seats Won By Democrats
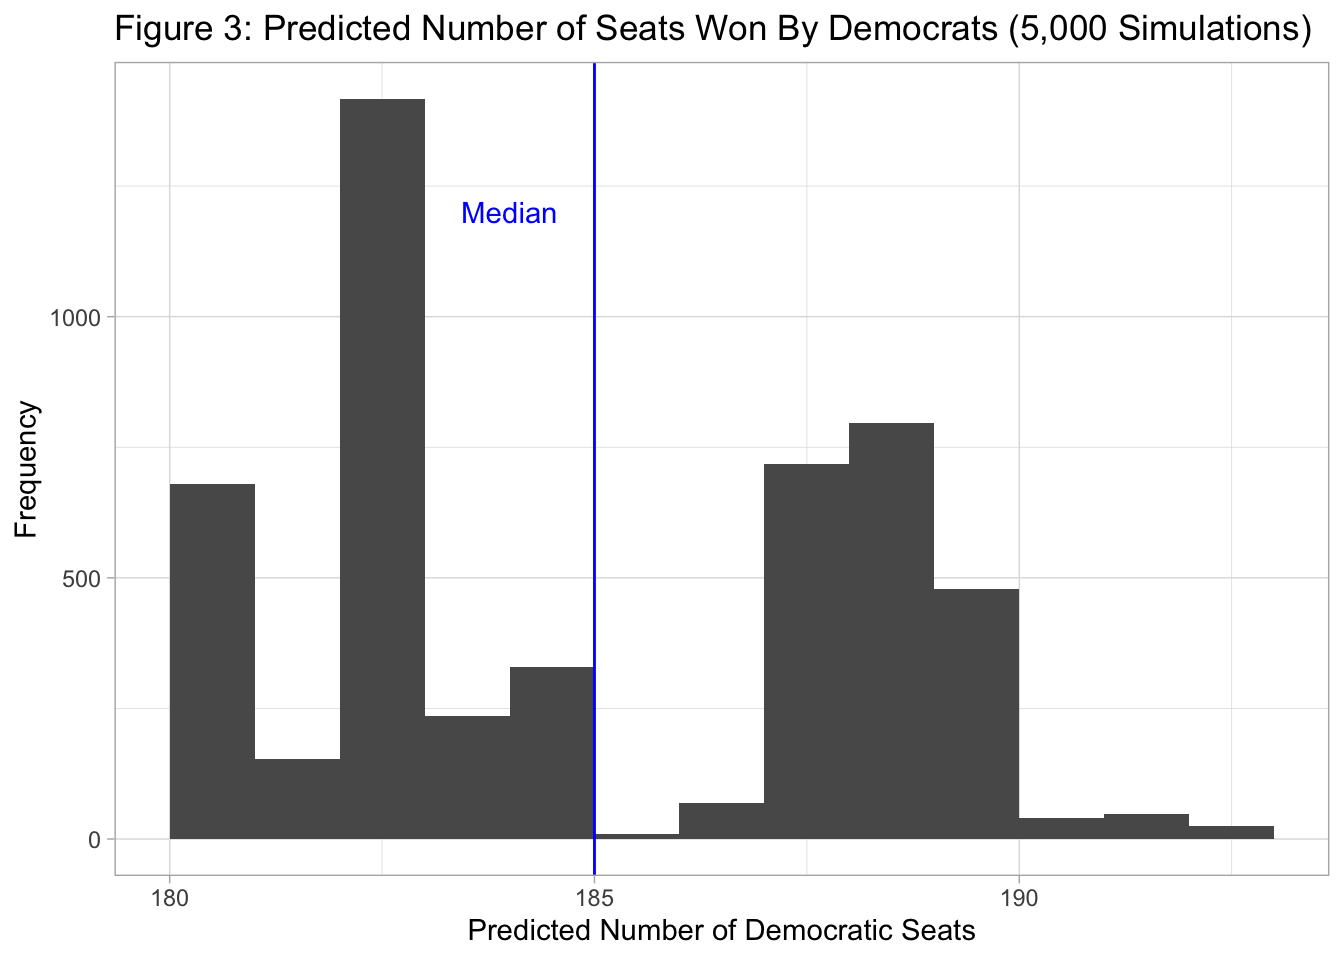
Lastly, I used Models 2a and 2b to predict how the 5,000 simulated nation-level vote shares translate into the Democratic vote shares at the district-level. Note that the data on expert ratings was retrieved from Ballotpedia (2022), the data on ads spending was retrieved from the Wesleyan Media Project (2022), and the data on demographics aggregated to the 2022 district-level was retrieved from Dave’s Redistricting (2022).
The median number of predicted Democratic seats was 185, and Democrats were predicted to lose the majority in all of the 5,000 simulations. One limitation of my method is that ultimately, the predictions for the number of seats that Democrats will win depends a lot on the Model 1. A small change in the predicted Democratic vote share based on Model 1 could change the predicted number of Democratic seats.
References
Achen, C. H. & Bartels, L. M. (2017). Democracy for realists :why elections do not produce responsive government. Princeton University Press.
Ballotpedia. (2022). United States Congress elections, 2022. https://ballotpedia.org/United_States_Congress_elections,_2022
Dave’s Redistricting. (2022). https://davesredistricting.org/maps#home
Fowler, A. & Hall, A. B. (2018). Do Shark Attacks Influence Presidential Elections? Reassessing a Prominent Finding on Voter Competence. The Journal of Politics, 80(4), 1423–1437. https://doi.org/10.1086/699244
Healy, A. & Malhotra, N. (2010). Random Events, Economic Losses, and Retrospective Voting: Implications for Democratic Competence. Quarterly Journal of Political Science, 5(2), 193–208. https://doi.org/10.1561/100.00009057
Wesleyan Media Project. (2022, October 6). Democrats Out-Pacing GOP in Senate Races. https://mediaproject.wesleyan.edu/releases-100622/