08-Final Prediction
Overview of Method
Similar to Bafumi et al. (2018), my model consists of two steps. First, I predict the Democratic popular vote share and run simulations to obtain a set of 5,000 potential outcomes at the nation-level (Model 1). Second, I predict the Democratic performance in each district relative to the nation-level Democratic performance (Model 2a, 2b). In the second step, the dependent variable of my model is the ratio between the Democratic vote share in a district in election t and the Democratic popular vote share in election t. In other words, I build a model to predict the extent to which the Democratic candidate in each district overperforms or underperforms relative to the nation-level Democratic vote share. To predict the Democratic vote share in each district, I multiply the predicted Democratic performance relative to the Democratic popular vote share by each one of the 5,000 simulated Democratic popular vote shares obtained in Step 1.
This method allows me to fully take into account the impact of redistricting. Especially in districts whose composition of the electorate changed greatly due to redistricting, it is inappropriate to rely on district-level historical data to predict the outcomes in 2022. In the second step of my model, I use a pooled model whereby I fit one regression across all districts instead of fitting a regression for each district. This means that the prediction for a certain district is based on historical data from different districts instead of the historical data in that particular district. Thus, even if the characteristics of a certain district changed greatly due to redistricting, we can rely on historical data from all districts to predict how well a Democratic candidate will perform in that district relative to the nation-level Democratic performance.
Step 1: Predict the Nation-Level Outcome
Model 1: Predicting the Democratic Popular Vote Share
My model to predict the Democratic popular vote share is as follows:

The independent variables are as follows:
- Midterm: The president’s party has lost seats in the House in all but 3 midterm elections since 1900 (Campbell, 2018, p.1). We can expect that the President’s party’s popular vote share tends to be lower in a midterm election.
- President’s party’s lead in the generic ballot: The literature suggests that the generic ballot is highly predictive of the outcomes of House elections (Abramowitz, 2018; Bafumi et al., 2018). Since polls tend to converge to the actual outcome closer to the election, I calculate the weighted average of the president’s party’s lead in generic ballot polls based on the recency of the poll (Gelman & King, 1993). I dropped the results of polls conducted prior to election year and gave each poll the following weight: (365 – number of days the poll was conducted before election day).
- Although studies have suggested that short-term economic growth prior to the election helps predict the popular vote share of the president’s party, I do not incorporate any economic variables into my model (Achen & Bartels, 2017). As I demonstrated in Blog Post 03, if the generic ballot is incorporated in the model, economic variables do not increase the model fit because the generic ballot and economic variables are correlated.

As expected, both variables are significant predictors of the president’s party’s vote share. All else equal, in a midterm election, the president’s party’s popular vote share declines by -1.34 points, and a 1 point increase in the president’s party’s lead in the generic ballot is associated with a 0.25 point increase in the president’s party’s popular vote share.
Model Validation
In-Sample Model Fit
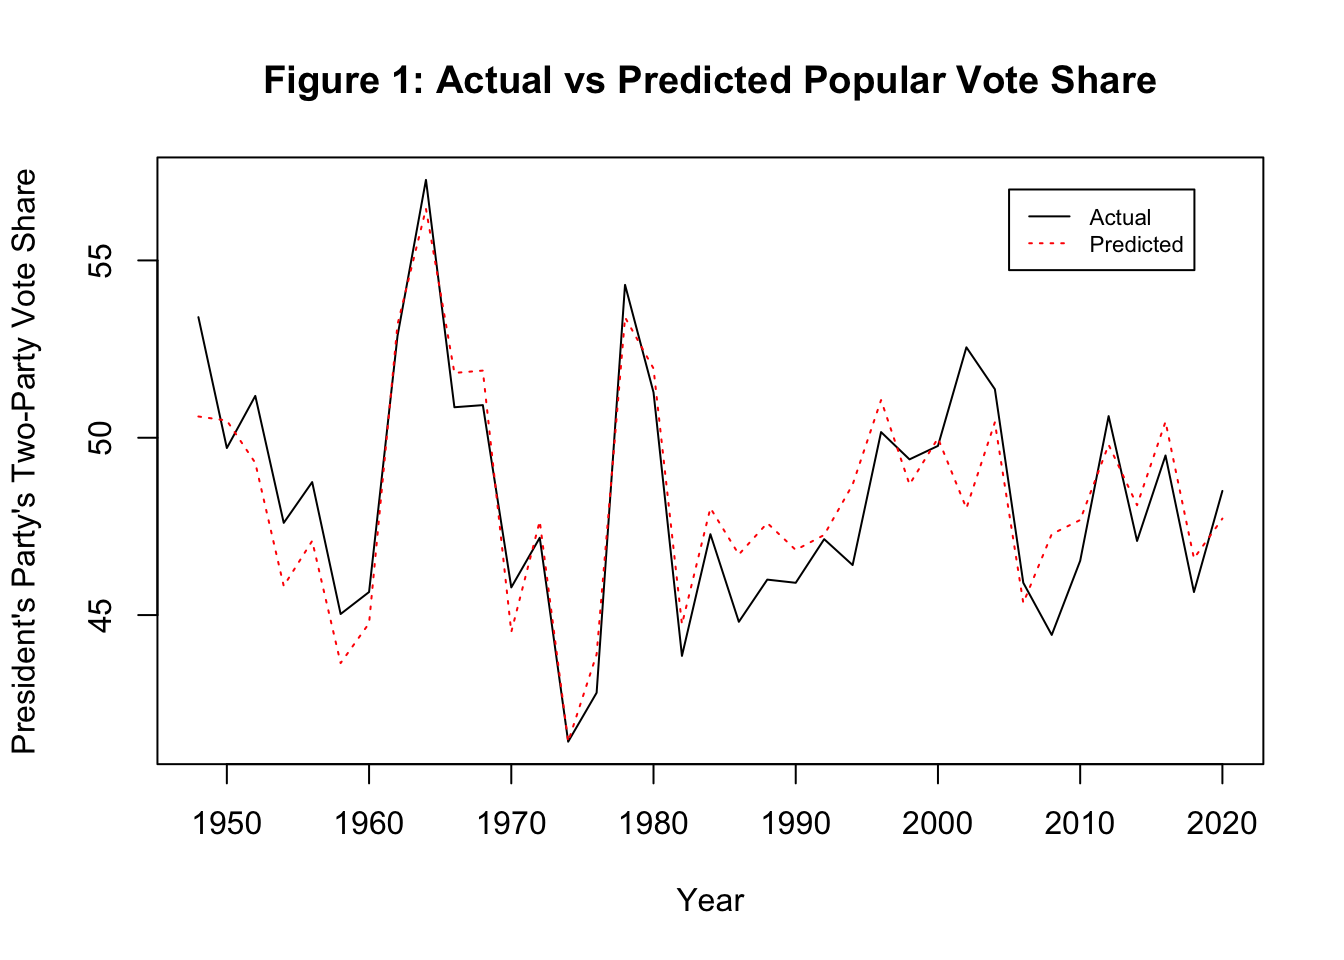
The adjusted R-squared of Model 1 is 0.805. As seen in Figure 1, the predicted values based on Model 1 roughly match the actual values. The root-mean-squared error (RMSE) is 1.45.
Out-Of-Sample Testing
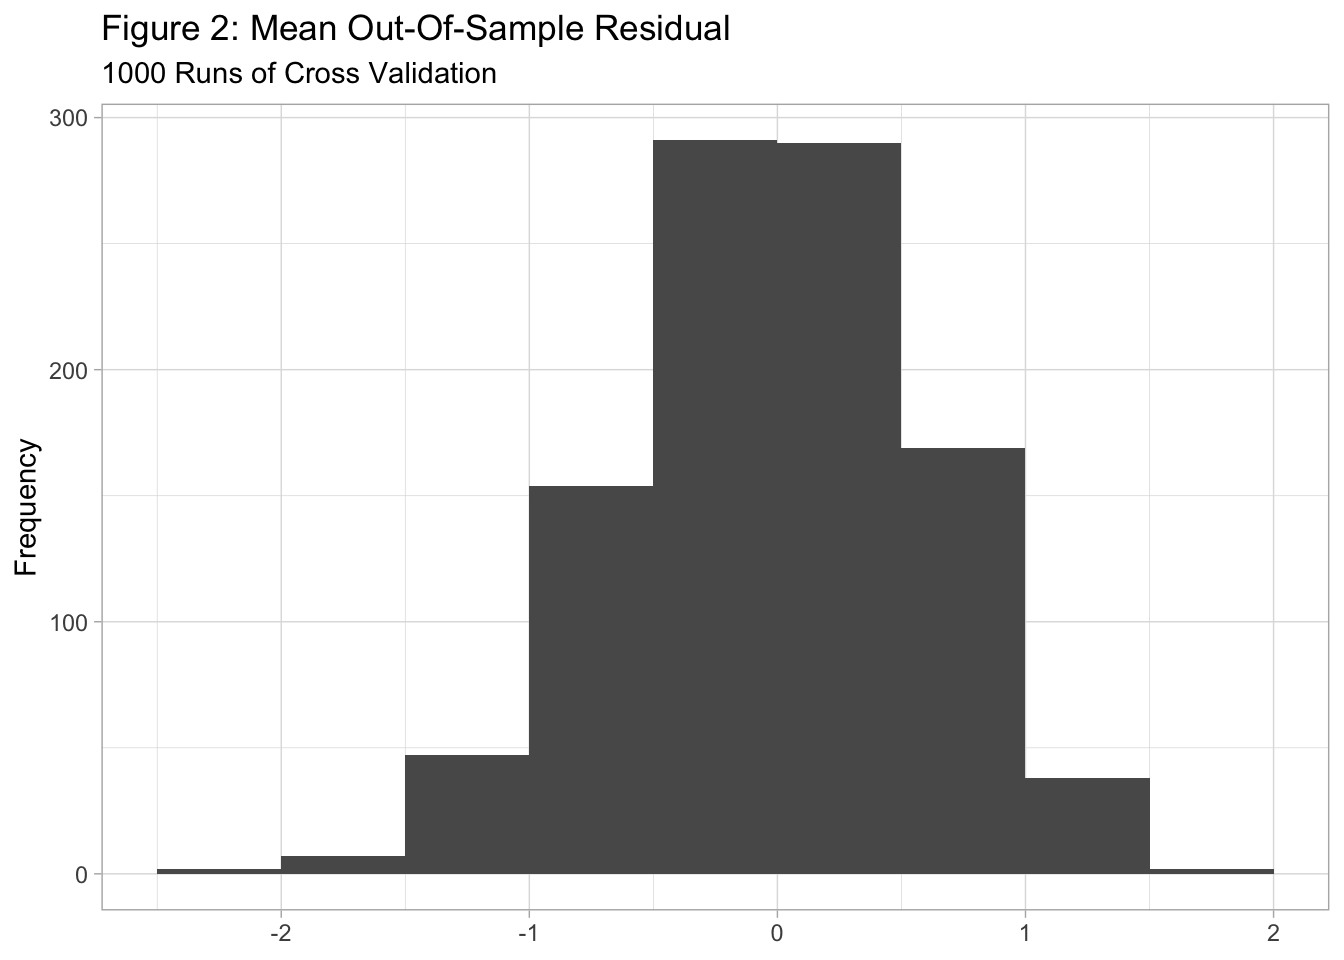
I test how well Model 1 predicts the Republican vote share in 2018 after holding out the 2018 election. The error is 1.005. I also conduct 1000 runs of cross-validation by randomly withholding 8 observations in each iteration, fitting the model on the rest of the observations, and evaluating how well the model predicts the observations that were held out. Figure 2 shows the distribution of the mean of the residual in each run. The mean of the residual tends to be between -1 and 1.
Prediction for 2022
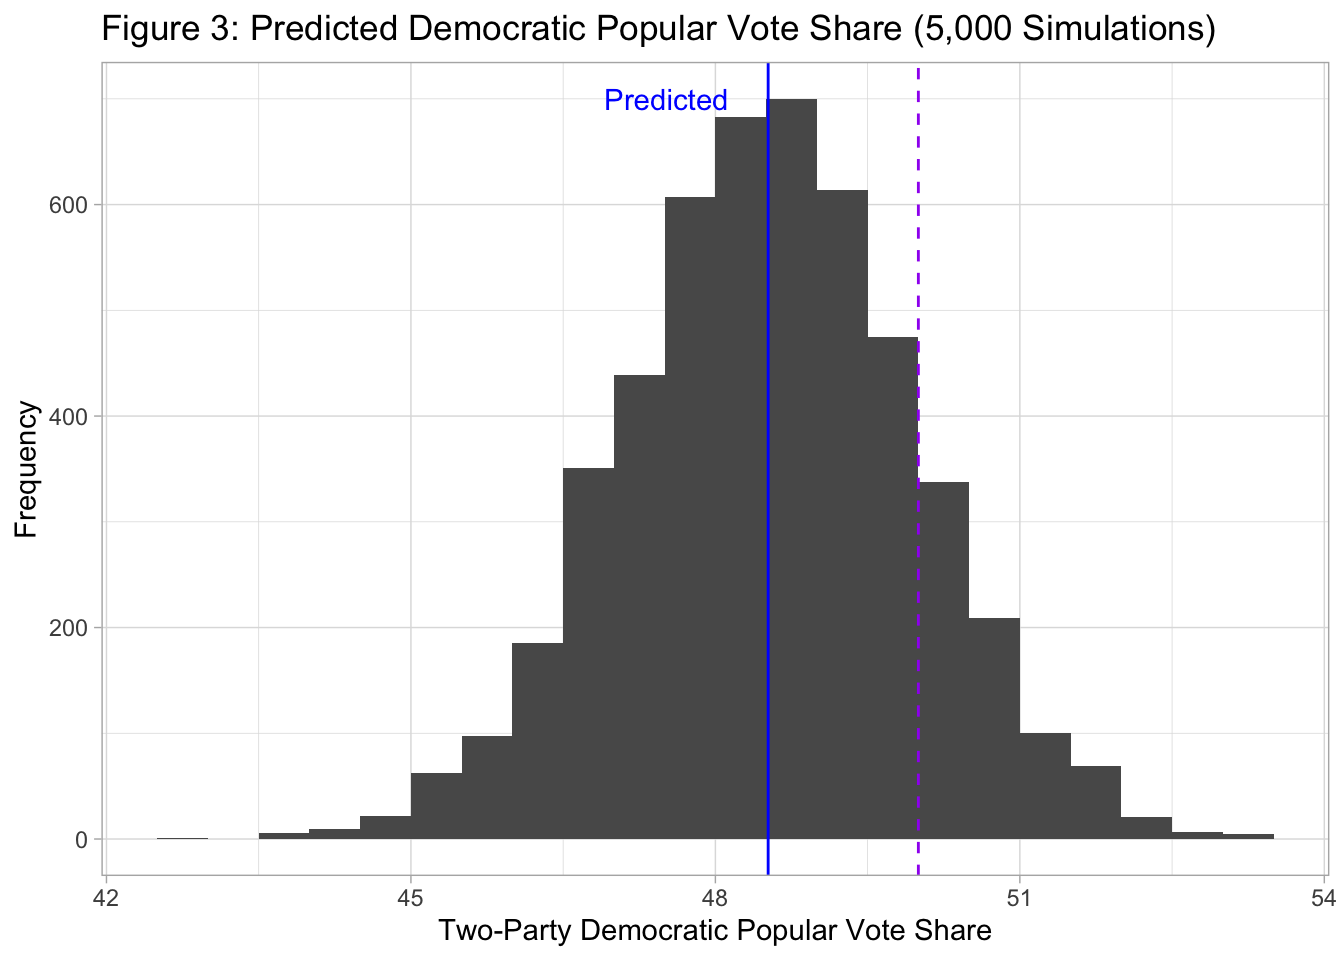
Based on Model 1, the predicted Democratic popular vote share in 2022 is 48.52. The prediction interval is [45.36, 51.68] . Data on the latest generic ballot polls was retrieved from FiveThirtyEight (2022) on November 5. The polls are weighted based on recency in the same way as described above.
Lastly, I obtain a set of 5,000 potential Democratic popular vote share by drawing a sample of size 5,000 from a normal distribution whose mean is the predicted Democratic vote share and whose standard deviation is the RMSE of Model 1. Democrats are predicted to win the popular vote in only 749 of the 5,000 simulations (Figure 3).
Step 2: Predict the District-Level Democratic Performance Relative to the Popular Vote Share
Next, I predict the district-level Democratic vote share relative to the Democratic popular vote share. The dependent variable is the ratio between the Democratic vote share in a district and the Democratic popular vote share. For this step, I build two models: one for districts where polling data is not available (Model 2a) and another for districts where polling data is available (Model 2b).
Model 2a: Without Polls
My model for districts where polling data is not available is:

This model is based on the district-level outcomes in the 2014 and 2018 midterm elections. The independent variables are the following:
- Democratic Presidential Candidate’s Vote Share in the Most Recent Presidential Election: This variable is included based on the assumption that Clinton’s vote share in the 2016 Presidential election in a certain district is correlated with the Democrat’s vote share in 2018 in that district and that Obama’s 2012 district-level vote share is correlated with the Democrat’s district-level vote share in 2014. Data was retried from the Daily Kos (Nir, 2020).
- Expert Rating: I take the average of the ratings of the Cook Political Report, Inside Elections, and Sabato’s Crystal Ball. The ratings were converted in to a 7-point scale, with 7 being “Solid/Safe Republican,” 4 being “Toss-up”, and 1 being “Solid/Safe Democrat.” If data on ratings was unavailable, I assumed that the actual outcome was what the experts had expected before the election. (i.e. 7 if a Republican won and 1 if a Democrat won.) This is a valid assumption because the districts where ratings are not available are safe seats.
- Incumbent: I assume that compared to a Democratic challenger, a Democratic incumbent is more likely to perform better relative to the Democratic popular vote share.
- I excluded did not incorporate data on ads because as shown in Blog Posts 05 and 06, ads seem to have a weak or statistically insignificant impact on district-level outcomes.
Model 2b: With Polls
My model for districts where polling data is available is:

The independent variables are the following:
- Democratic candidate’s lead in polls: I calculate the Democratic candidate’s lead in the polls and for each district, I take the weighted average based on the recency of the poll. The weights for recency are the same as the weights I used in Model 1.
- Democratic Presidential Candidate’s Vote Share in Most Recent Presidential Election
- Democratic Incumbent

For both Model 2a and 2b, all the variables seem to be significant predictors. The magnitudes of the coefficients are hard to interpret because the dependent variable is a ratio measuring the district-level Democratic performance relative to the popular vote share. Note that the negative coefficient on expert ratings makes sense because a larger value of the exert ratings means that the Republican candidate was favored to win.
Model Validation
In-Sample Model Fit
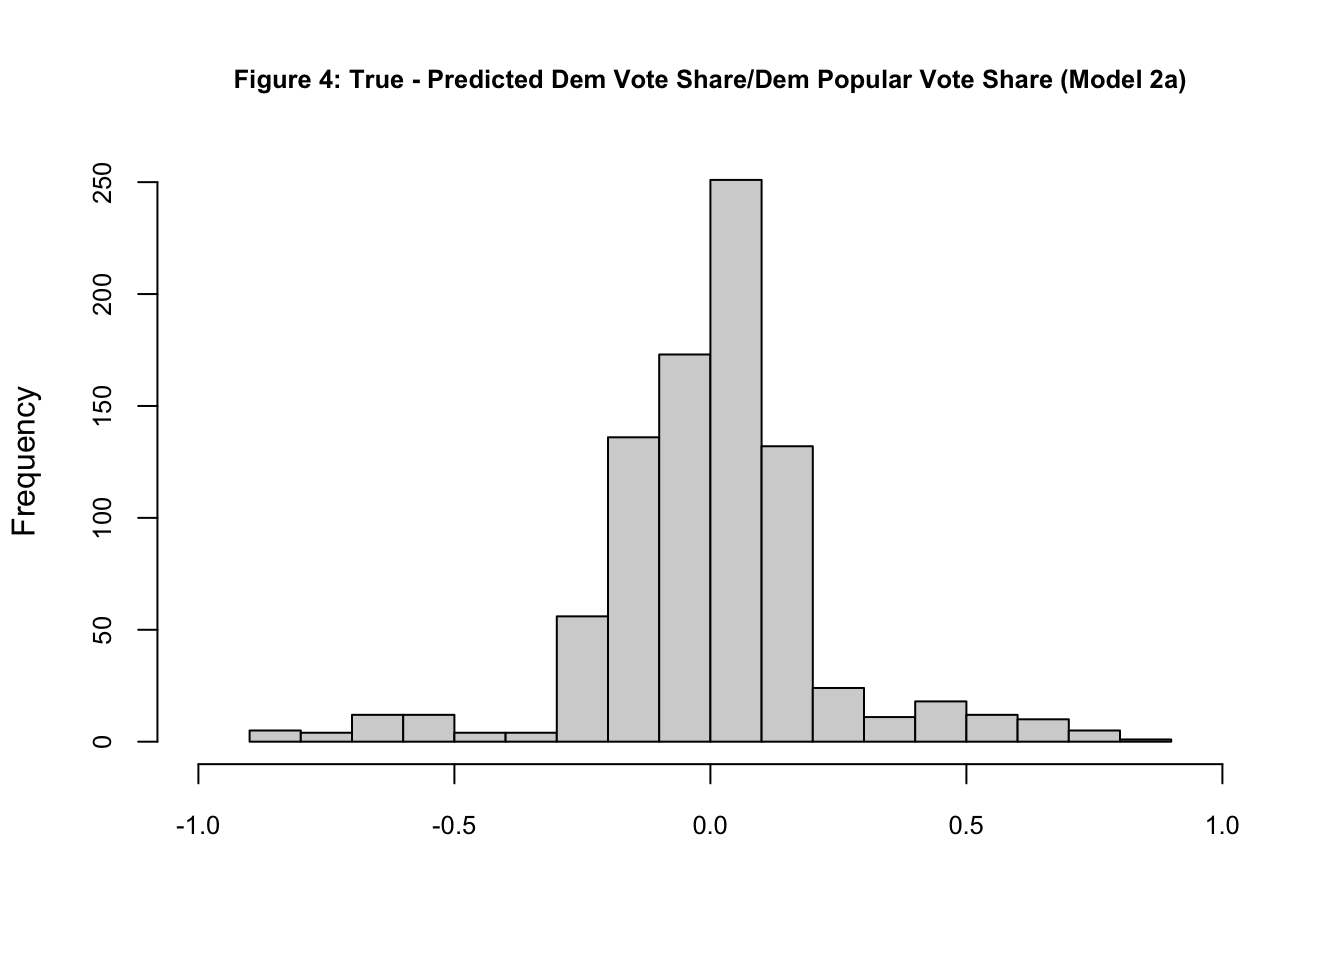
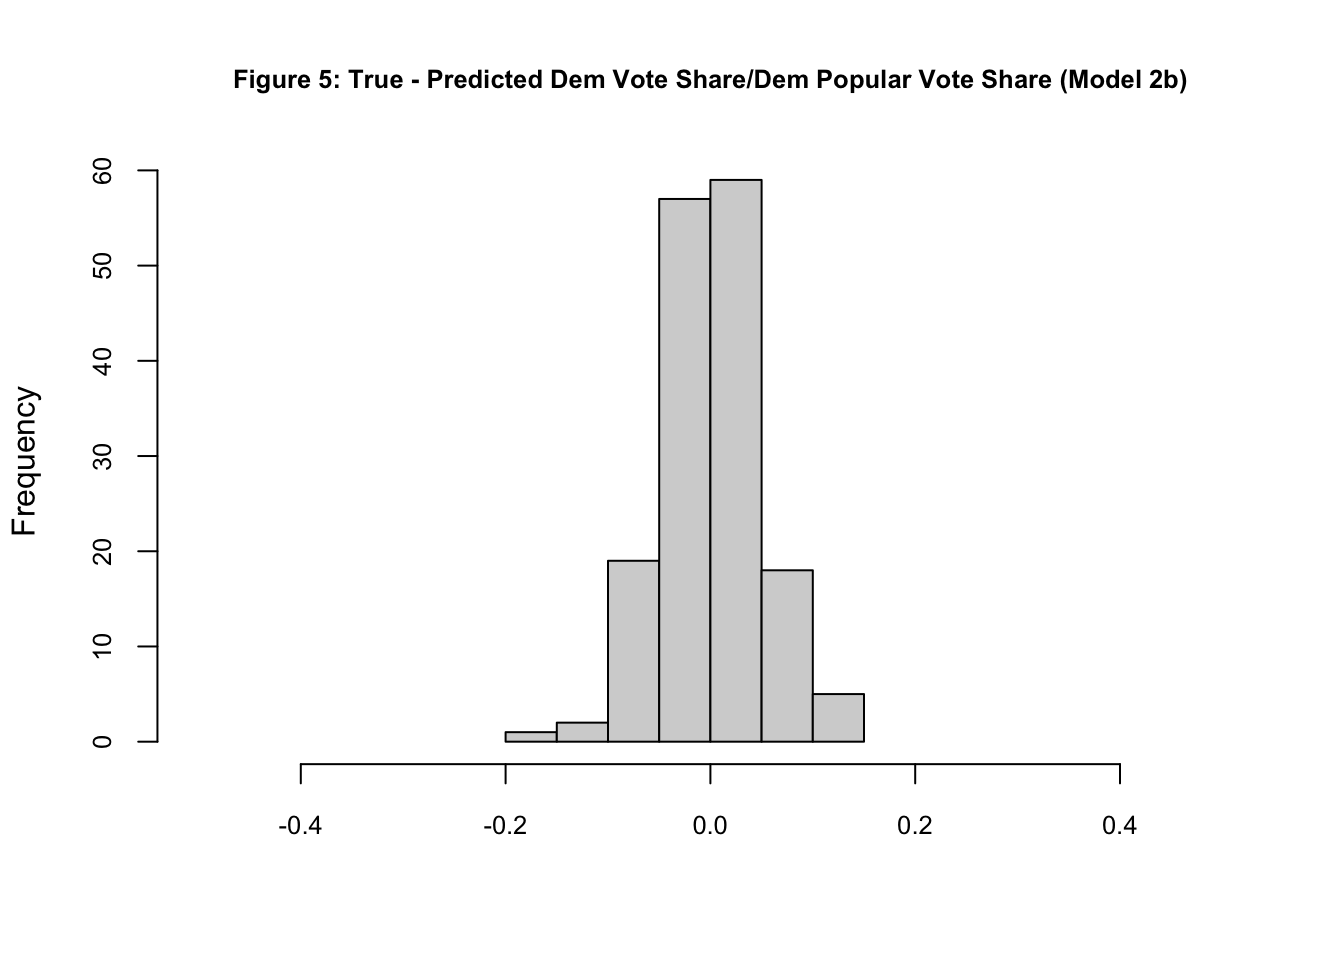
The adjusted R-squared is 0.775 for Model 2a and 0.892 for Model 2b. As seen in Figures 4 and 5, the in-sample errors are centered around 0 for both Models 2a and 2b, but the range of the in-sample-errors is larger for Model 2a. This makes sense because Model 2b incorporates polling data while Model 2a does not, which should make Model 2b more accurate. The in-sample RMSE for Model 2a is 0.23 and the in-sample RMSE for Model 2b is 0.05.
Out-Of-Sample Testing
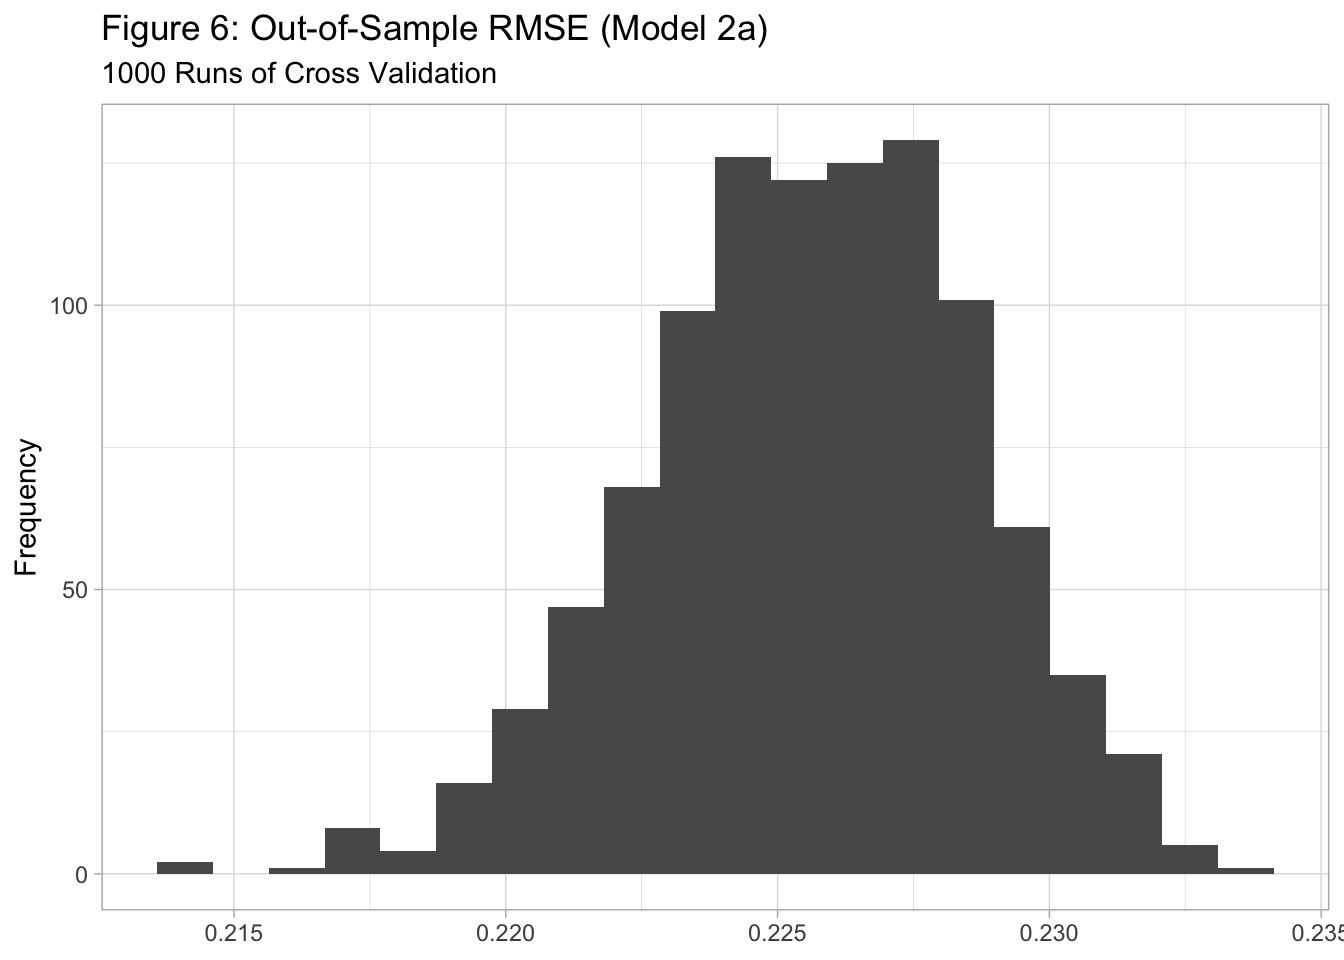
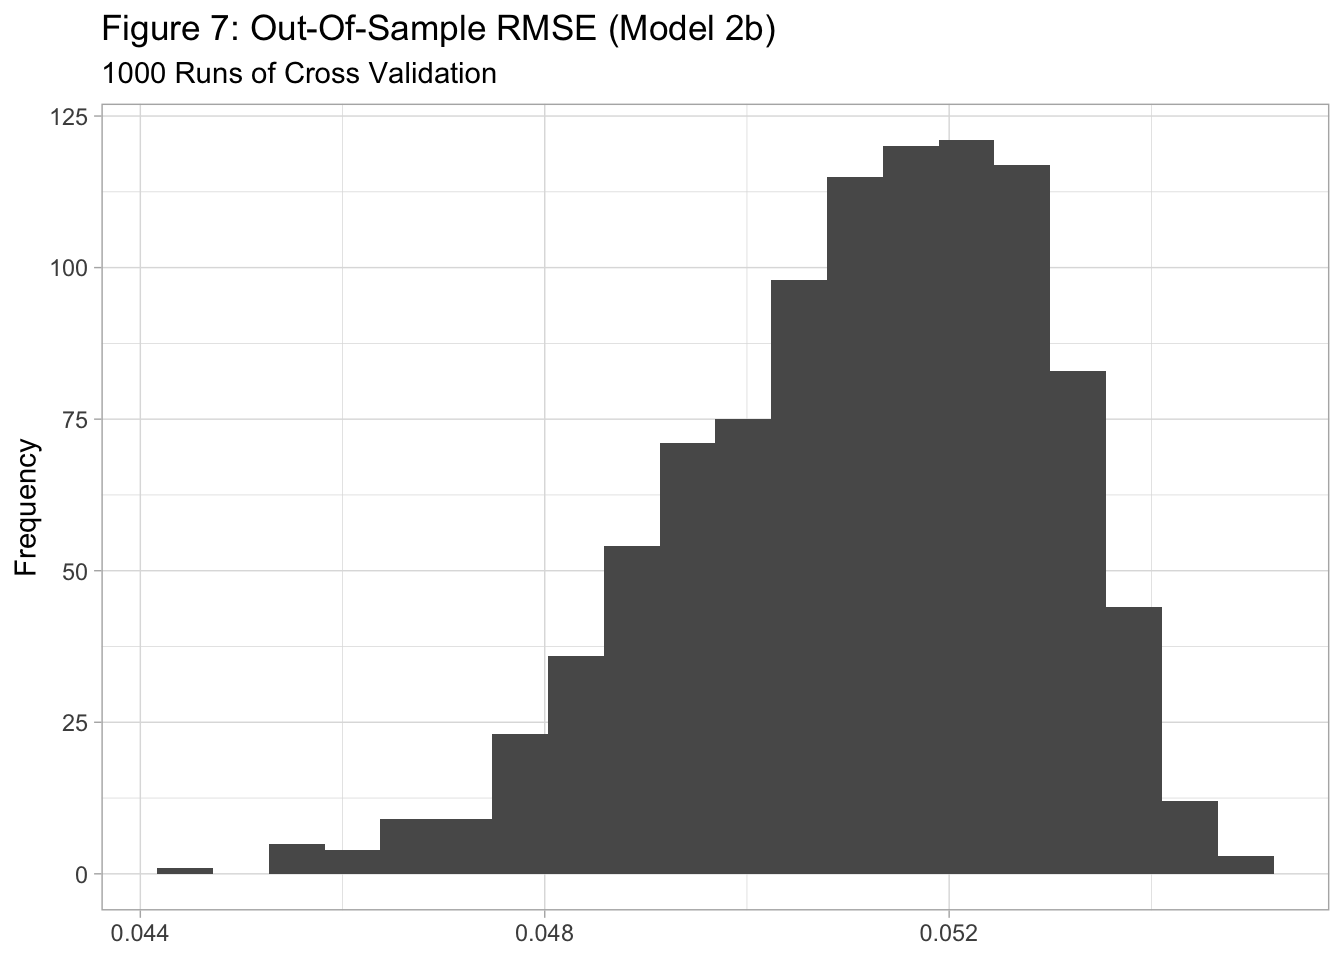
For Model 2a, I conduct 1000 runs of cross-validation by randomly withholding 100 observations in each iteration, fitting the model on the rest, and evaluating how well the model predicts the held-out observations. I do the same for Model 2b except I withhold 30 observations in each iteration. Figure 6 and 7 show the distribution of the out-of-sample RMSE. Not surprisingly, the size of the out-of-sample RMSE tends to be larger for Model 2a. The distribution is somewhat left-skewed for Model 2b.
District-Level Prediction for 2022
To predict the district-level outcomes, first, I use Models 2a and 2b to predict the extent to which the Democratic candidate in each district is predicted to overperform/underperform relative to the nation-level Democratic vote share. Data on expert ratings is based on Ballotpedia (2022) as well as the data provided in class. Data on Joe Biden’s vote share in each post-redistricting district was retried from Dave’s Redistricting (2022). Next, I obtain a set of 5,000 potential Democratic vote shares in each district by multiplying the predicted ratio in each district by the 5,000 potential Democratic popular vote shares obtained in Step 1. In doing so, I add a disturbance that is randomly drawn from a normal distribution whose mean is 0 and whose standard deviation is the in-sample RMSE of Model 2a and Model 2b in order to take into account the uncertainty in Step 2 of my model.
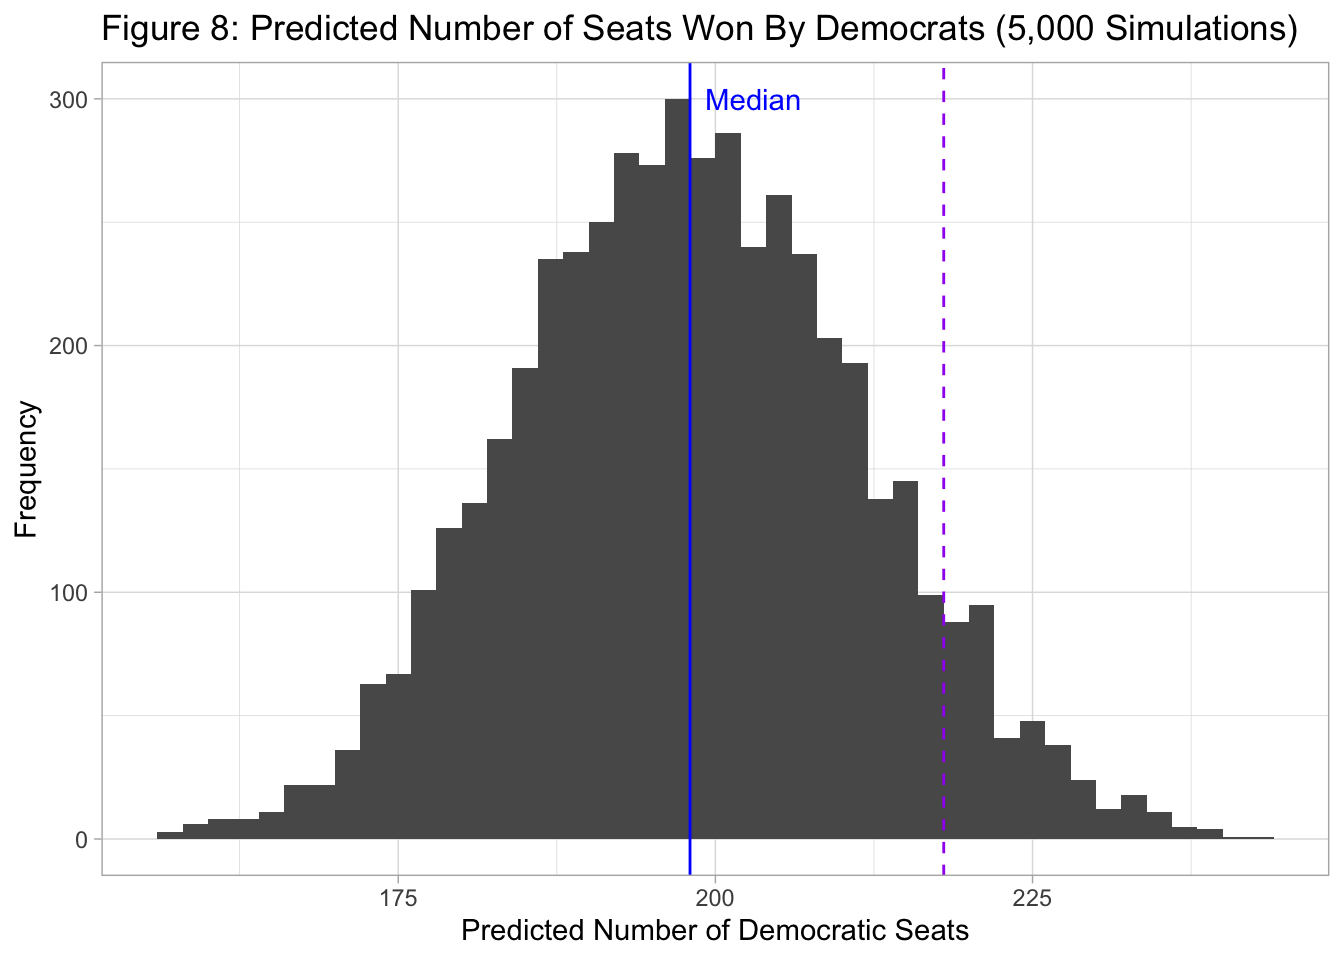
Through these steps, I obtain a set of 5,000 simulated outcomes, and for each of the 5,000 simulations, I count the number of districts where Democrats are predicted to win (Figure 8). The median of the predicted number Democratic seats is 198. Democrats are predicted to retain their majority in the House in 427 out of the 5,000 simulations, meaning that they are likely to lose their majority in the House.
Competitive Districts

The advantage of my model is that I can obtain a set of potential district-level vote shares for each district, taking into account the uncertainty in both Model 1 and Model 2a/2b. In California’s 22nd Congressional District, the median of the predicted Democratic vote share is 49.78 and Rudy Salas (D) is predicted to win in 2300 out of the 5000 simulations (Figure 7). This suggests that the race is a pure toss-up.
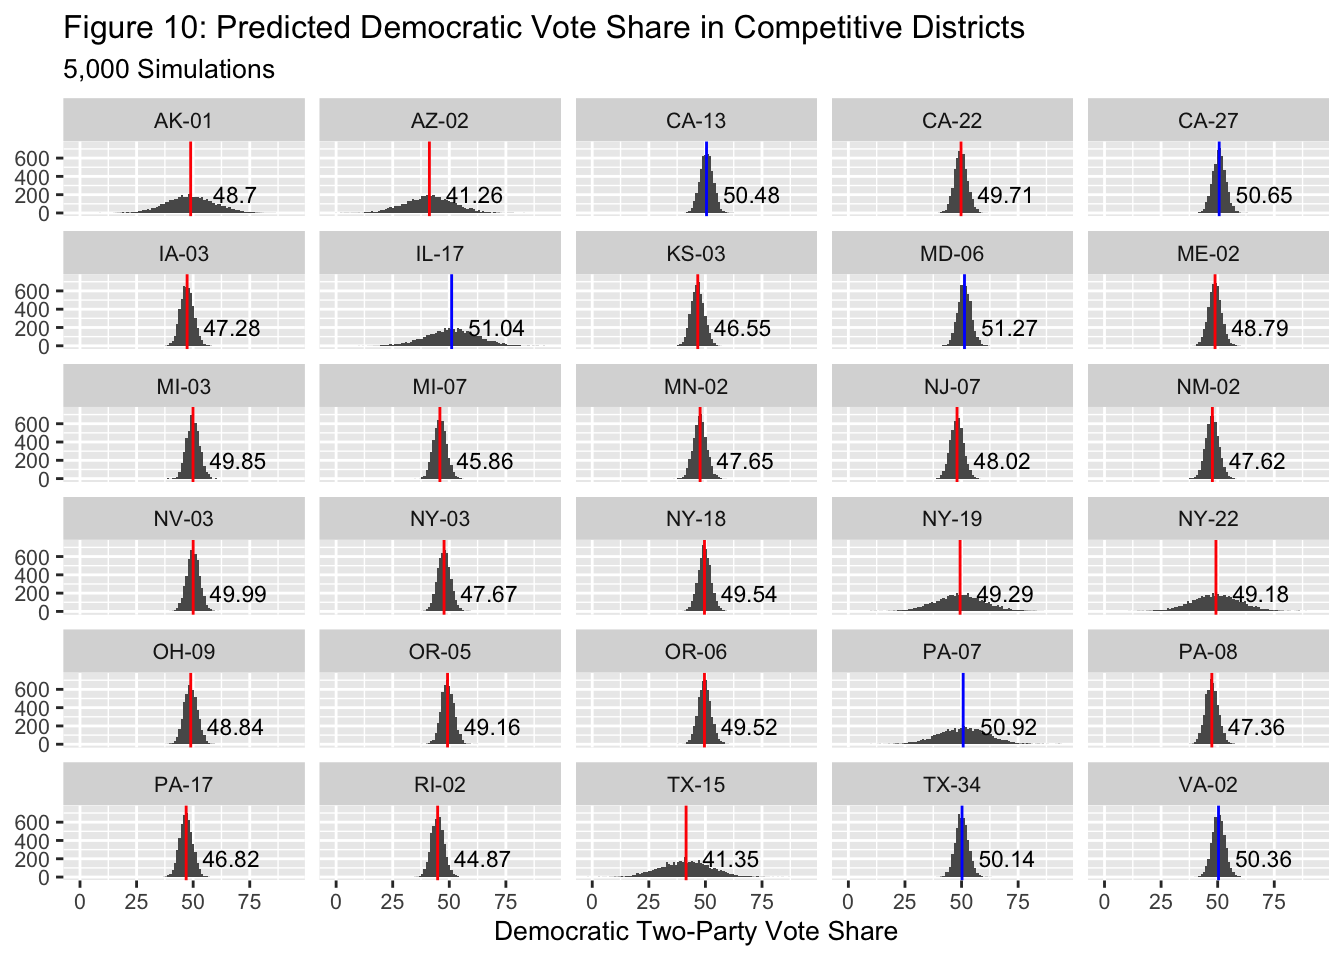
Figure 10 shows the distribution of the predicted Democratic vote shares in 30 competitive districts. The median of the predicted Democratic vote share is larger than 50 in 7 out of the 30 districts, meaning that Republicans may be slightly favored to win in most of the competitive districts. However, in all 30 districts, a Democratic two-party vote share of 50 is well within the range of the simulated Democratic vote shares, which confirms that the 30 districts are all competitive races that could go either way. Note that the range of the distribution is wider for districts where polling data was not readily available (e.g., AK-01, AZ-02). This makes sense because Model 2a yields larger errors, meaning that the size of the randomly generated disturbance tends to be larger.
References
Abramowitz, A. (2018). Will Democrats Catch a Wave? The Generic Ballot Model and the 2018 US House Elections. PS: Political Science & Politics, 51(S1), 4-6. doi:10.1017/S1049096518001567
Achen, C. H. & Bartels, L. M. (2017). Democracy for realists :why elections do not produce responsive government. Princeton University Press.
Bafumi, J., Erikson, R., & Wlezien, C. (2018). Forecasting the 2018 Midterm Election using National Polls and District Information. PS: Political Science & Politics, 51(S1), 7-11. doi:10.1017/S1049096518001579
Ballotpedia. (2022). United States Congress elections, 2022. https://ballotpedia.org/United_States_Congress_elections,_2022
Campbell, J. (2018). Introduction: Forecasting the 2018 US Midterm Elections. PS: Political Science & Politics, 51(S1), 1-3. doi:10.1017/S1049096518001592
Dave’s Redistricting. (2022). https://davesredistricting.org/maps#home
FiveThirtyEight. (2022, November 5). Do Voters Want Republicans or Democrats in Congress? https://projects.fivethirtyeight.com/polls/generic-ballot/
Gelman, A., & King, G. (1993). Why Are American Presidential Election Campaign Polls So Variable When Votes Are So Predictable? British Journal of Political Science, 23(4), 409–451. https://doi.org/10.1017/S0007123400006682
Nir, D. (2020, November 19). Daily Kos Elections’ presidential results by congressional district for 2020, 2016, and 2012. Daily Kos. https://www.dailykos.com/stories/2012/11/19/1163009/-Daily-Kos-Elections-presidential-results-by-congressional-district-for-the-2012-2008-elections