09-Post-Election Reflection
In this blog post, I will assess the accuracy of my models and discuss why my models were wrong in some respects. The data was last updated in the morning of Monday, November 21.
1. Recap of Models and Predictions
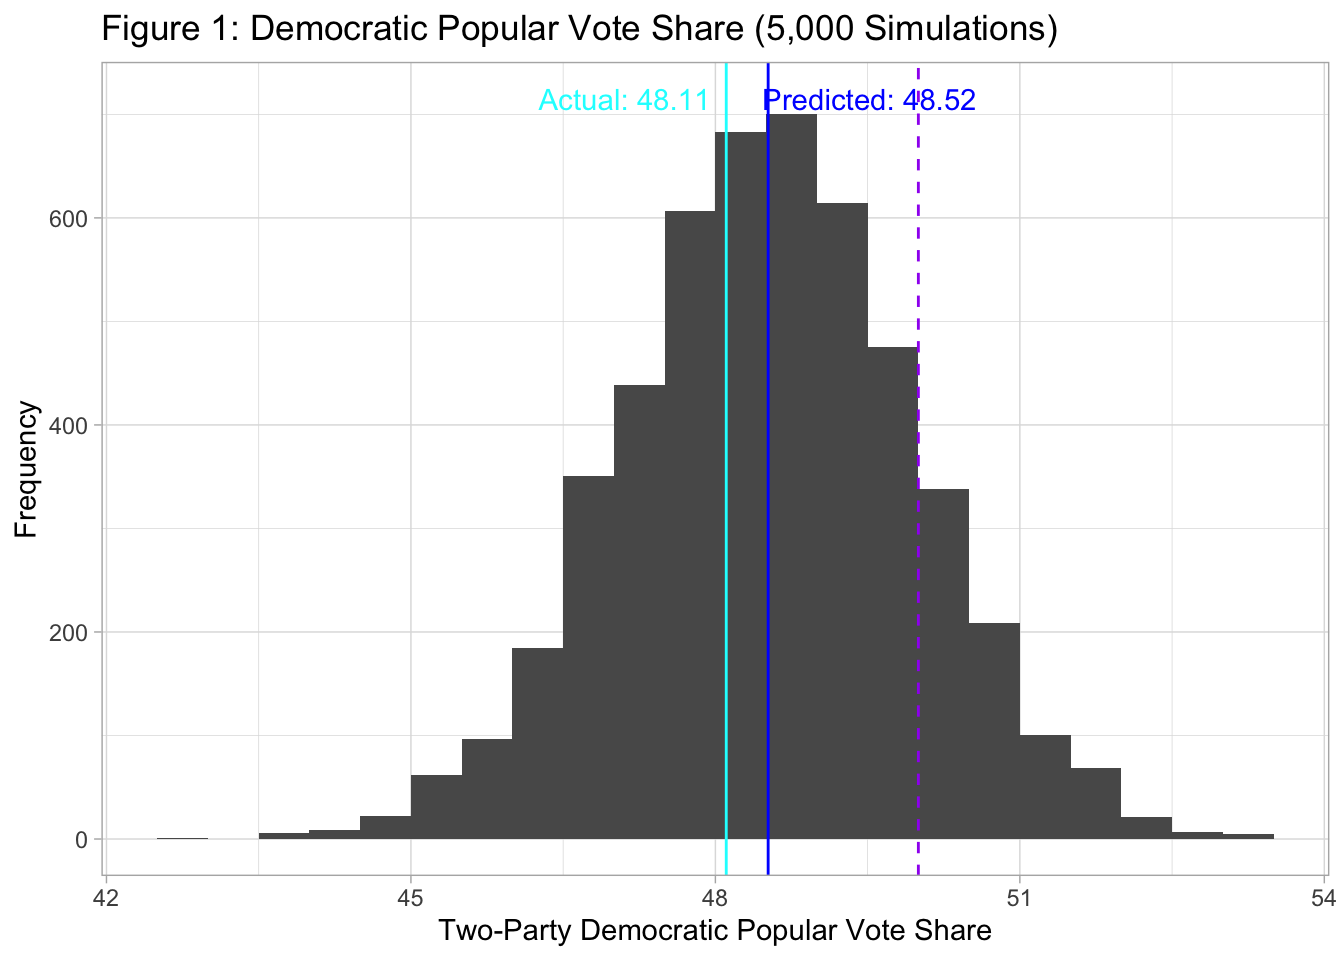
Inspired by Bafumi et al. (2018), I built a forecast model made up of two steps. First, I predicted the Democratic popular vote share and simulated 5,000 potential outcomes at the national level (Model 1). I obtained a set of 5,000 draws from a normal distribution whose mean is the predicted Democratic two-party popular vote share and whose standard deviation is the RMSE of Model 1. Next, to forecast the district-level vote share, I predicted the ratio between the Democratic vote share in a certain district in election t and the Democratic nation-wide vote share in election t (Model 2a, 2b). By multiplying the predicted value of this ratio in each district by the 5,000 simulated Democratic popular vote shares obtained in the first step, I obtained a set of 5,000 potential Democratic vote shares for each district. When multiplying the predicted value of Model2a/2b by the predicted value of Model 1, I added a disturbance drawn from a normal distribution whose mean is 0 and whose standard deviation is the RMSE of Model 2a/2b.
The equation for Model 1 is:

The generic ballot and whether the election was a midterm election were the only independent variables.
Model 2a was used for districts without polling data:

In lieu of polling data, I used the average of the ratings determined by the Cook Political Report, Inside Elections, and Sabato’s Crystal Ball.
Model 2b was used for districts with polling:

Models 2a/2b were pooled models. I took into account redistricting by incorporating data on Joe Biden’s vote share aggregated to the post-redistricting district-level.
Using Model 1, I predicted that the Democratic two-party popular vote share would be 48.52 (Prediction interval: [45.36, 51.68]). Democrats were predicted to lose the popular vote in 4251 out of the 5000 simulations (Figure 1). As for the district-level prediction, I predicted a landslide victory for the Republicans, with the most probable outcome being Democrats winning 198 seats (Figure 2). Democrats were predicted to win the majority of seats in only 427 out of the 5,000 simulations.
2. Accuracy & Patterns in the Inaccuracy
Model 1: Democratic Popular Vote Share
I overpredicted the Democratic two-party popular vote share by 0.41 points. This error is relatively small compared to the magnitude of the errors of the 10 models that political scientists built prior to the 2016 Presidential elections. The errors of those 10 models ranged from 0.1 to 3.6 (Campbell et al., 2017). The high accuracy of Model 1 may appear surprising given that it was only based on two variables: the generic ballot and the midterm penalty. This is yet another evidence that the generic ballot is highly predictive of electoral outcomes, as it has been suggested repeatedly (Abramowitz, 2018; Bafumi et al, 2018).
Model 2: Democratic Seat Share
The district-level forecast was less accurate. Democrats are currently projected to win 213 seats, which is more than the 198 that I had predicted (Figure 2). Although 213 is within the range of 5,000 potential outcomes, there is no denying that I overpredicted Republican wins at the district-level. My district-level forecast would have been even worse if I had predicted the popular vote share more accurately. Since I multiply the predicted Democratic popular vote share by the predicted value of Model 2a/2b, my district-level forecast would have predicted an even larger Republican landslide if the predicted Democratic popular vote share was lower and closer to the actual outcome. Clearly, there was something wrong with Model 2a/2b.
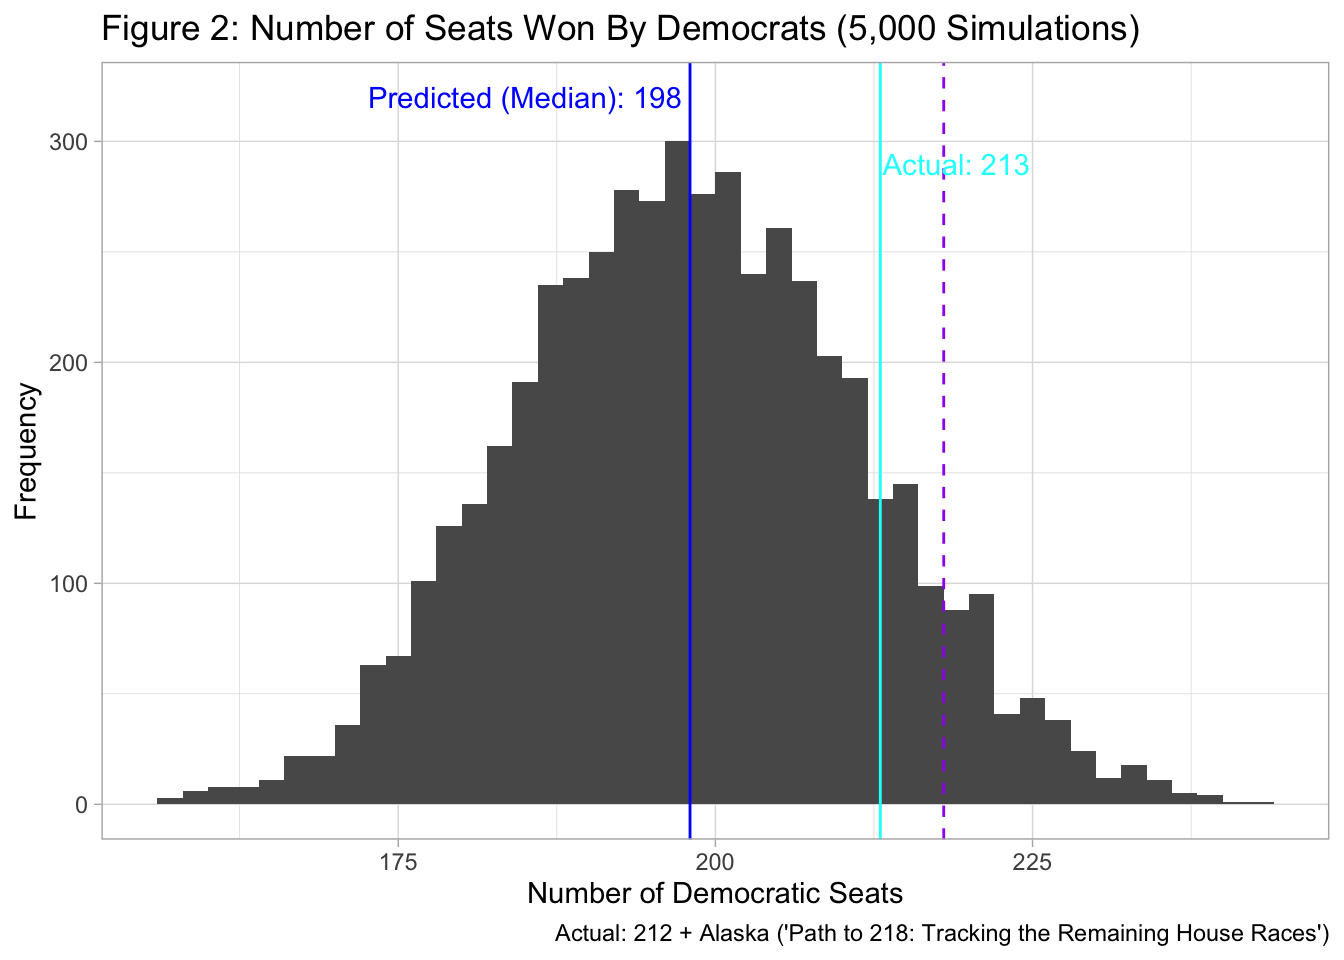
Table 1 suggests that Model 2b, which is the model that was used for districts with polling data, is responsible for the large error at the district level. Model 2a, which is the model for districts without polling data, correctly predicted the winner in over 99% of the races while model 2b predicted the winner correctly in only 61.3% of the races. Although it may seem counterintuitive that the availability of polls made the predictions worse, Model 2b’s low classification accuracy makes sense after considering the types of districts for which the models were used. Model 2a was used for districts without polling data, which are districts that are less competitive and more predictable. Since district-level polling tends to be conducted in competitive districts, the districts for which Model 2b was used were harder to predict by nature. This is reflected in the Brier scores. Since Model 2a tended to yield a predicted probability of a Democratic victory closer to 0 or 1, the Brier score is low. Meanwhile, the predicted probability of a Democratic victory based on Model 2b ranged from 0.395 to 0.594, so the Brier score is higher. (In this case, the predicted probability of a Democratic victory in a district is the share of the 5,000 simulations that resulted in a Democratic victory.)
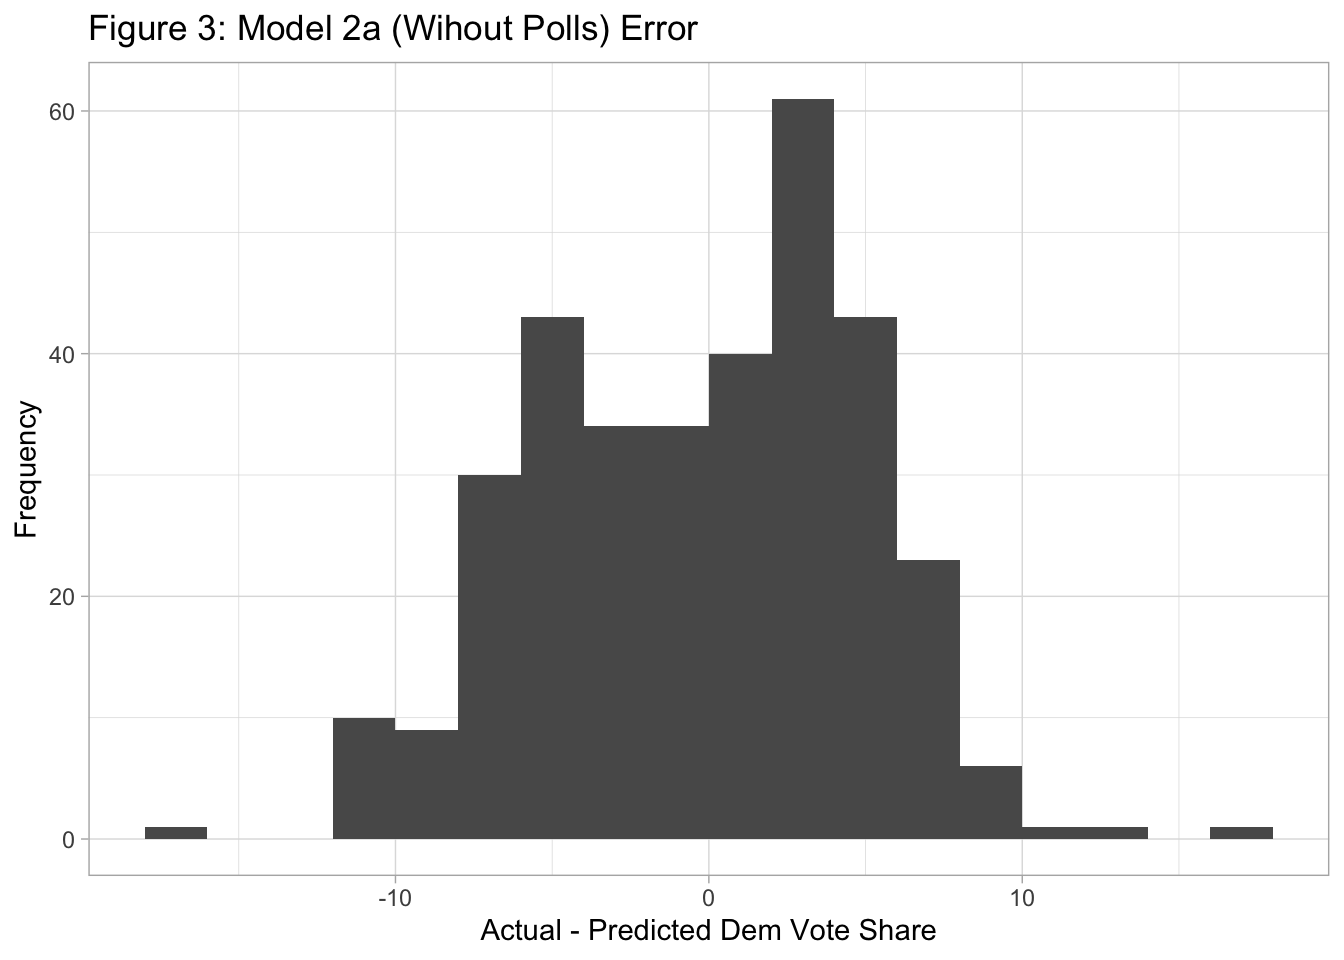
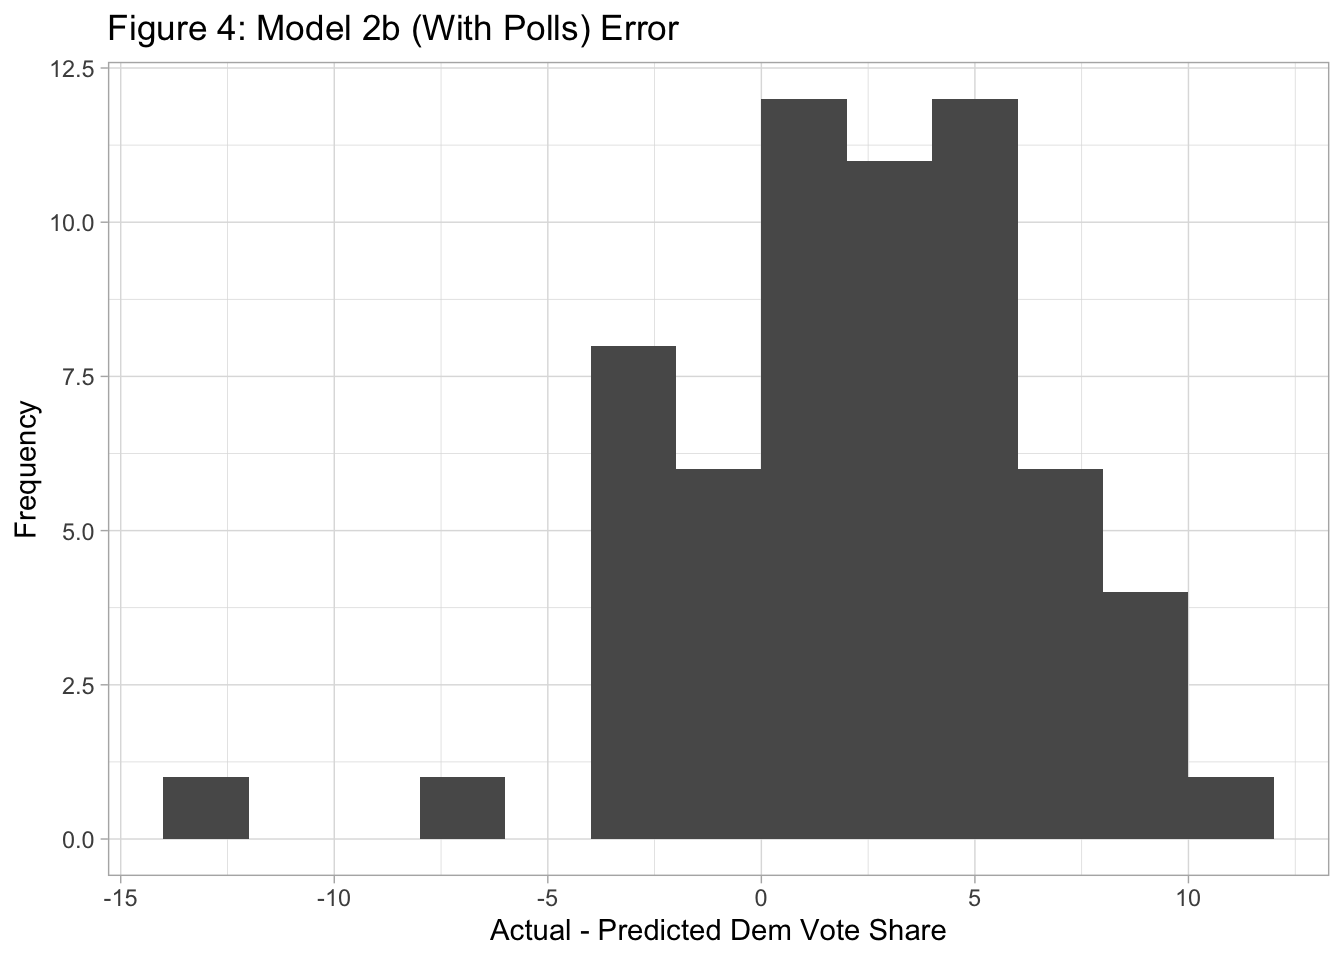
Table 1 also shows that the RMSE was lower for Model 2b. Although Model 2a accurately predicted the winner over 99% of the time, the error of the vote share tended to be large (Figure 3). The error of Model 2b tended to be small but tended to be positive, which reflects the fact that Model 2b overpredicted Republican victories (Figure 4). Overall, these analyses suggest that Model 2a predicted the winner better than Model 2b but that Model 2b predicted the exact Democratic vote share more accurately.
| Table 1: Summary of Models | |||
| Overall | Model 2a (Without Polls) | Model 2b (With Polls) | |
|---|---|---|---|
| Dem Seats Predicted | 198 | 175 | 18 |
| Dem Seats Actual | a 213 | 177 | 36 |
| Classification Accuracy | 0.940 | b 0.995 | c,d 0.613 |
| Vote Share RMSE | e 5.055 | e 5.089 | e 4.862 |
| Brier Score | 0.117 | 0.097 | 0.235 |
| a 212 + Alaska ('Path to 218: Tracking the Remaining House Races') | |||
| b Predicted R/Actual D: AK-01, WA-03 | |||
| c Predicted R/Actual D: CO-07, CO-08, KS-03, ME-02, MI-03, MI-07, MI-08, MN-02, NV-03, NM-02, NY-18, NC-01, NC-13, OH-01, OH-09, OH-13, OR-04, OR-06, PA-08, PA-17, RI-02 | |||
| d Predicted D/Actual R: CA-13, CA-27, VA-02 | |||
| e Excluding uncontested races | |||
There was no clear pattern in terms of the locations where the predictions were inaccurate (Figure 5). However, it is interesting to note that the predictions were wrong in several districts in three battleground Midwestern states: Ohio, Michigan, Minnesota. Midwestern states have been battleground states in recent presidential elections even as states in other states have become more reliably blue or red. Although it is unclear the extent to which this applies to House elections, Hopkins (2017) argues that the Midwest is a rare area in which a sizable portion of the electorate is open to persuasion by campaigns (pp. 202-207).

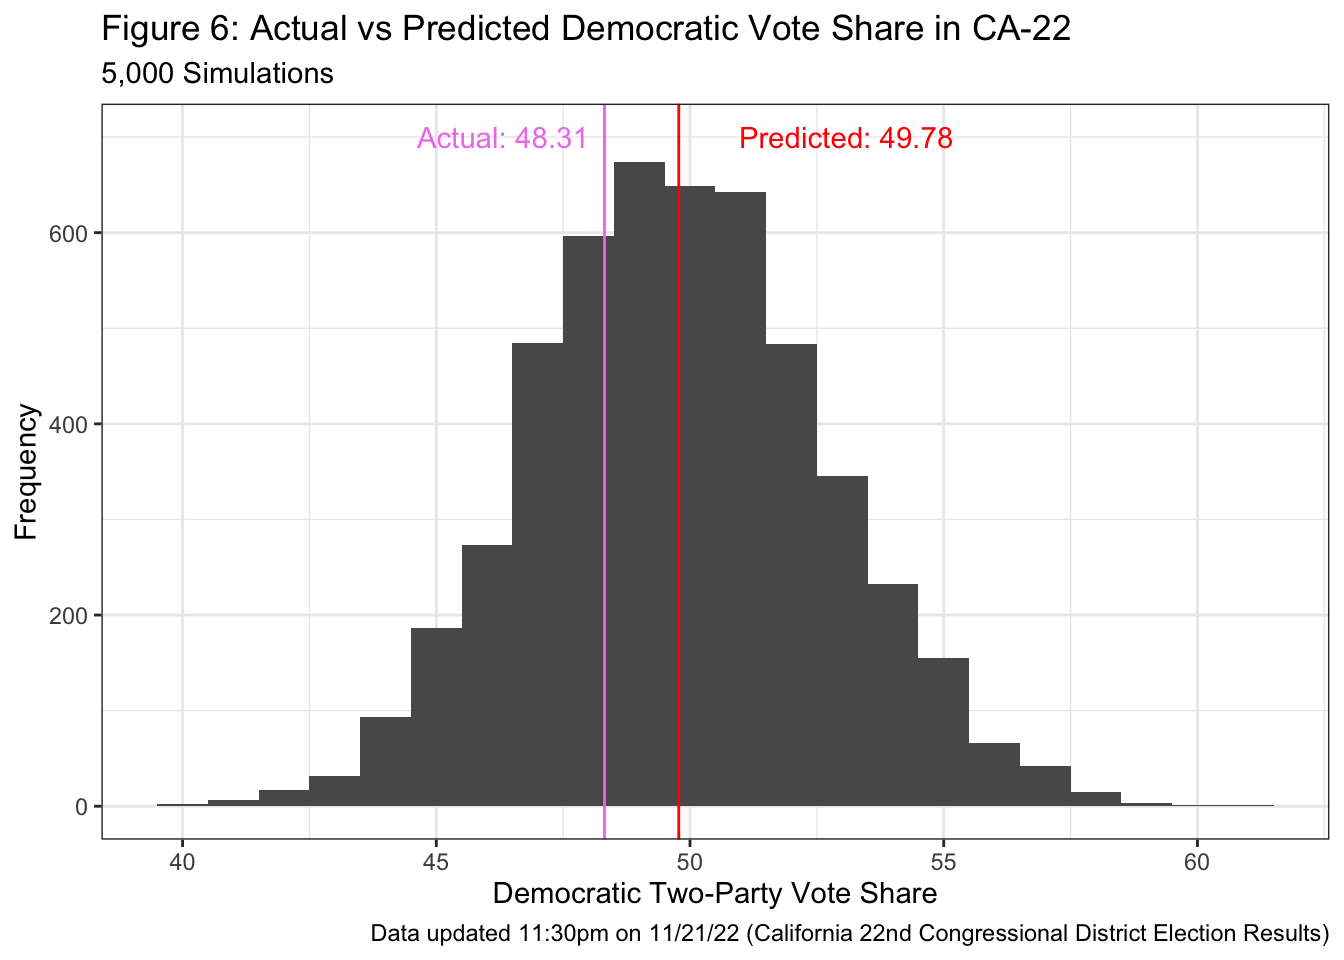
CA-22
California’s 22nd District ended up being extremely competitive, and the race was not called until late at night Eastern Time on Monday November 21. Indeed, I had expected that the race would be close: the predicted Democratic vote share was 49.78 and 2700 out of the 5000 simulations predicted a Republican victory. As of 23:30 on November 21, Rudy Salas (D) has won 48.31% of the votes counted. Although there are still ballots that have yet to be counted, it is safe to say that my prediction that the race would be extremely close but that David Valadao (R) has a very narrow advantage turned out to be accurate.
3. Hypothesis: Why was Model 2 Inaccurate?
Since Model 1 was very accurate, I will discuss why Models 2a/2b were inaccurate.
Hypothesis 1: Democratic candidates did well in open seats.
The districts where I failed to accurately predict the outcomes tended to be districts without an incumbent. Out of the 23 districts that Democrats won even though I had predicted that Republicans would win, 17 did not have a Democratic incumbent. Moreover, out of those 17, 10 were open seats (Ballotpedia, 2022). It is possible that Democrats did well in open seats, and this is a factor that I did not take into account in my model. In Models 2a/2b, I coded incumbency as =1 if there was a Democratic incumbent in the district and =0 otherwise. Thus, I did not distinguish open seats from districts where a Republican candidate challenged a Democratic incumbent. Taking into account whether a seat was open was especially important in this election since 7 new seats were created due to redistricting.
Hypothesis 2: Trump’s endorsement had a negative impact on Republican candidate’s performance.
Pundits have suggested that low-quality or extreme candidates endorsed by former President Trump tended to underperform in competitive districts and that this could have been the reason why Republicans did not gain as many seats as expected (Cohn, 2022; Wallach, 2022). I did not include candidates’ ideology or Trump’s endorsement in the model, which could have led me to overestimate Republican strength in several districts. Interestingly, in all 5 districts for which Wallach (2022) argues that the “Trump penalty” had a pivotal impact (NC-13, OH-13, OH-9, PA-08, WA-03), my models falsely predicted a Republican victory.
Hypothesis 3: The model was overfit on 2014 and 2018 data.
The key assumption behind Model 2a/2b was that the 2014 and 2018 elections would help us predict candidates’ district-level performance relative to the national popular vote share in 2022. However, it is possible that district-level vote share tends to deviate from the popular election more in some elections than others. The 2014 midterms resulted in a landslide victory for Republicans in the House and the 2018 midterms resulted in a Democratic landslide victory. For these two elections, the ratio between the district-level vote share and the popular vote share could have been larger than in 2022. This could have made the predicted values for Model 2a/2b larger than the actual values. Even though Model 1 suggested that the Republicans have a slight advantage over Democrats, if the magnitude of the predicted values in Model 2a/2b was too large, the Republican advantage at the district level would have been amplified. The risk of overfitting on the training data would have been mitigated if there were more data points in the training data. However, due to data availability issues, I only used data from 2014 and 2018.
4. How to Test Proposed Hypothesis
Testing Hypothesis 1: Performance in open seats
To see whether Democrats did well in open seats this election cycle, I could conduct a difference-in-differences test, where the treatment group is open seats and the control group is other seats. If we compare the 2018 district-level Democratic vote share and the 2022 district-level Democratic vote share, on average, the control group most likely experienced a decline between 2018 and 2022 since 2018 was a landslide victory for Democrats. Democratic candidates in open seats on average could have experienced a decline in the vote share, but if this decline is smaller than the decline seen among the control group, that would be in line with my hypothesis that Democrats did relatively well in open seats in 2022.
Testing Hypothesis 2: Trump’s endorsement
Pundits have already begun trying to estimate the impact of Trump’s endorsement. Cohn (2022) compared how “MAGA Republicans” (as defined by the Cook Political Report) versus other Republicans performed relative to Trump’s performance in 2020. Traditional Republicans on average performed better relative to Trump’s performance in 2020 while “MAGA Republicans” on average did not do better than Trump. Cohn (2022) concludes that “MAGA Republicans” did worse relative to traditional Republicans by approximately 5 percentage points. Wallach (2022) compares the vote share of candidates endorsed by Trump with the predicted vote share based on the Cook PVI. Focusing on competitive districts, he finds that candidates endorsed by Trump tended to perform worse relative to expectations. Wallach (2022)’s approach seems more plausible because assuming that the expected vote share is accurate and that all relevant variables were included when modelling the expected vote share, the difference between the predicted vote share and the actual vote share can be interpreted as the causal effect of Trump’s endorsement.
Testing Hypothesis 3: Overfitting on 2014 and 2018 data
I would need to test whether the ratio between the district-level vote share and the popular vote share tended to be larger in 2014 and 2018 compared to that ratio in 2022 through pairwise t-tests. If the ratio was in fact larger in 2014 and 2018, that would confirm my hypothesis that the predictions for 2022 were affected by the greater deviation of the district-level vote share from the popular vote share in 2014 and 2018.
5. How I Might Change My Model
If I were to build a model again, I would address the weaknesses of my model in the following way:
Code incumbency as a categorical variable
Instead of coding incumbency as a binary variable that only reflects whether there is a Democratic incumbent, I could code incumbency as =0 if there is a Republican incumbent, =1 if the seat is an open seat, and =2 if there is a Democratic incumbent. I could add other categories to further distinguish between different incumbency status such as whether an incumbent candidate used to represent a different district but switched districts. Such cases were seen often in 2022 because of redistricting.
Include ideology in the model
Including Trump’s endorsement would be difficult because we would have to restrict our training data to elections in which Trump endorsed House candidates. For reference, some suggest that Trump’s endorsement cost as many as 11 House seats in the 2018 midterm elections (Ballard et al., 2021). To allow the training data to be based on more elections, I could include measures of the candidate’s ideology in the model. Literature suggests that nominating extreme candidates in the primaries tends to have a negative impact on the party’s electoral outcomes (Hall, 2015).
Expand the scope of the training data
If overfitting on the 2014 and 2018 midterms was indeed an issue, I would consider adding data from earlier elections to the training data. The main issue with this approach is that redistricting happens decennially, and that redistricting could change how competitive districts tend to be. This could affect how candidates tend to do relative to the popular vote share. I would need to see whether incorporating data from two or more redistricting cycles ago is helpful.
References
Abramowitz, A. (2018). Will Democrats Catch a Wave? The Generic Ballot Model and the 2018 US House Elections. PS: Political Science & Politics, 51(S1), 4-6. doi:10.1017/S1049096518001567
Bafumi, J., Erikson, R., & Wlezien, C. (2018). Forecasting the 2018 Midterm Election using National Polls and District Information. PS: Political Science & Politics, 51(S1), 7-11. doi:10.1017/S1049096518001579
Ballard, A.O., Hassell, H. J. G., & Heseltine, M. (2021). Be Careful What You Wish For: The Impacts of President Trump’s Midterm Endorsements. Legislative Studies Quarterly, 46(2), 459–491. https://doi.org/10.1111/lsq.12284
Ballotpedia. (2022). United States Congress elections, 2022. https://ballotpedia.org/United_States_Congress_elections,_2022#Open_seats
California 22nd Congressional District Election Results. (2022, November 21). New York Times. https://www.nytimes.com/interactive/2022/11/08/us/elections/results-california-us-house-district-22.html
Campbell, J.E., Norpoth, H., Abramowitz, A. I., Lewis-Beck, M. S., Tien, C., Erikson, R. S., Wlezien, C., Lockerbie, B., Holbrook, T. M., Jerôme, B., Jerôme-Speziari, V., Graefe, A., Armstrong, J. S., Jones, R. J., & Cuzán, A. G. (2017). A Recap of the 2016 Election Forecasts. PS: Political Science & Politics, 50(2), 331–338. https://doi.org/10.1017/S1049096516002766
Cohn, N. (2022, November 16). Trump’s Drag on Republicans Quantified: A Five-Point Penalty. New York Times. https://www.nytimes.com/2022/11/16/upshot/trump-effect-midterm-election.html
Donner, D. (2022). Congressional District Hexmap version 3. Daily Kos. https://dkel.ec/map
Hall, A.B. (2015). What happens when extremists win primaries? American Political Science Review, 109(1), 18–42.
Hopkins, D.A. (2017). Red Fighting Blue: How Geography and Electoral Rules Polarize American Politics. Cambridge University Press. https://doi.org/10.1017/9781108123594
Path to 218: Tracking the Remaining House Races. (2022, November 21). New York Times. https://www.nytimes.com/interactive/2022/11/10/us/elections/results-house-seats-elections-congress.html?action=click&pgtype=Article&state=default&module=election-results&context=election_recirc®ion=NavBar
Wallach, P. (2022). We can now quantify Trump’s sabotage of the GOP’s House dreams. Washington Post. https://www.washingtonpost.com/opinions/2022/11/15/data-trump-weighed-down-republican-candidates/